

Sky Solar Holdings, Ltd. SKYS
7.17 0.00 (+0.00%)
At closeOct 8, 2020, 4:00 PM EDT
6.83 Day range 9.49
52-week range unavailable
- Market cap
- 150.41M
- Forward P/E
- -179.25
- Volume
- 377.19K
- Open
- 9.49
- Previous close
- 7.17
- Day's range
- 6.83 – 9.49
- Analysts
- Strong Buy
- Earnings date
- May 21, 2018
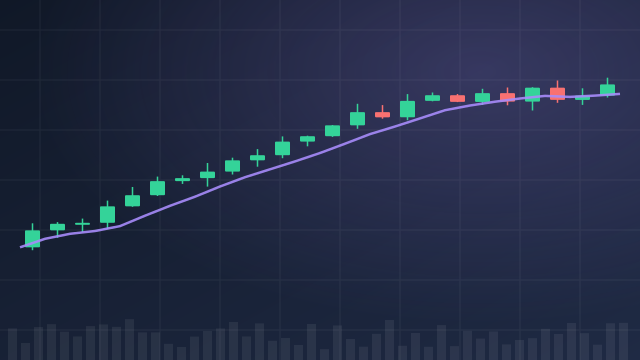
No chart data for this range yet.
Key statistics
- Price / sales
- 0.00
- Dividend yield
- 0.00%
- Payout ratio
- 0.00%
- Revenue growth
- 0.00%
- Free cash flow
- 0
- Total cash
- 0
- Total debt
- 0
- Return on equity
- 0.00%
- 50-day average
- 7.17
- 200-day average
- 6.00
Analyst view
Consensus: strong buy
Strong buy
Price target (mean) —
Ratings (0m) 2 2 buy · 0 hold · 0 sell
- Strong buy1
- Buy1
- Hold0
- Sell0
- Strong sell0
Next earnings
May 21, 2018
Expected May 21, 2018. Consensus EPS estimate 0.00.
Financials — quick view
SKYS Revenue — annual 48.95M
SKYS Net income — annual -42.06M
SKYS EPS — annual -2.00
Earnings
| Report date | Quarter ending | EPS estimate | EPS reported | Surprise | Surprise % |
|---|---|---|---|---|---|
| May 21, 2018 | Dec 1, 2017 | -0.07 | — | — | — |
| Feb 14, 2018 | Sep 1, 2017 | 0.03 | — | — | — |
| Sep 28, 2017 | Jun 1, 2017 | 0.01 | — | — | — |
| Jun 30, 2017 | Mar 1, 2017 | -0.03 | — | — | — |
News
 61 Biggest Movers From Yesterday
 Stocks That Hit 52-Week Highs On Wednesday
 SHAREHOLDER ACTION REMINDER: The Schall Law Firm Announces the Filing of a Class Action Lawsuit Against Sky Solar Holdings, Ltd. and Encourages Investors with Losses in Excess of $100,000 to Contact the Firm
 SHAREHOLDER ACTION ALERT: The Schall Law Firm Announces the Filing of a Class Action Lawsuit Against Sky Solar Holdings, Ltd. and Encourages Investors with Losses in Excess of $100,000 to Contact the Firm
 Labaton Sucharow LLP Files Securities Class Action Lawsuit Against Sky Solar Holdings, Ltd. and Its Potential Acquirers
 81 Biggest Movers From Yesterday
 Stocks That Hit 52-Week Highs On Tuesday
 Stocks That Hit 52-Week Highs On Thursday
- 33 Stocks Moving in Thursday's Pre-Market Session
- 72 Biggest Movers From Friday
Your note
Sign in to keep a note on SKYS — it syncs with the Stock Master app.