

State Street SPDR S&P Dividend ETF SDY
160.87 USD -1.80 (-1.11%)
At closeNov 6, 2026, 4:00 PM EST
160.87 0.00 0.00%
After hours · Nov 6, 4:00 PM ET
159.57 Day range 161.71
135.85 52-week range 166.61
- YTD
- +15.60%
- 1 year
- +18.22%
- Market cap
- 22.51B
- EPS (ttm)
- 8.61
- P/E ratio
- 18.67
- YTD return
- +15.60%
- 1-year return
- +18.22%
- Volume
- 351.74K
- Avg volume
- 204.31K
- Open
- 160.02
- Previous close
- 162.67
- Day's range
- 159.57 – 161.71
- 52-week range
- 135.85 – 166.61
3M +2.99 (+1.89%)
Key statistics
- Enterprise value
- 0
- PEG ratio
- 0.00
- Price / sales
- 0.00
- Price / book
- 0.00
- Dividend yield
- 0.00%
- Payout ratio
- 0.00%
- Revenue growth
- 0.00%
- Free cash flow
- 0
- Total cash
- 0
- Total debt
- 0
- Return on equity
- 0.00%
- Short % of float
- 0.00%
- 50-day average
- 153.78
- 200-day average
- 151.96
Next earnings
Consensus EPS estimate 0.00.
About State Street SPDR S&P Dividend ETF
The fund generally invests substantially all, but at least 80%, of its total assets in the securities comprising the index. The index is designed to measure the performance of the highest dividend yielding S&P Composite 1500® Index constituents that have followed a managed-dividends policy of consistently increasing dividends every year for at least 20 consecutive years.
News
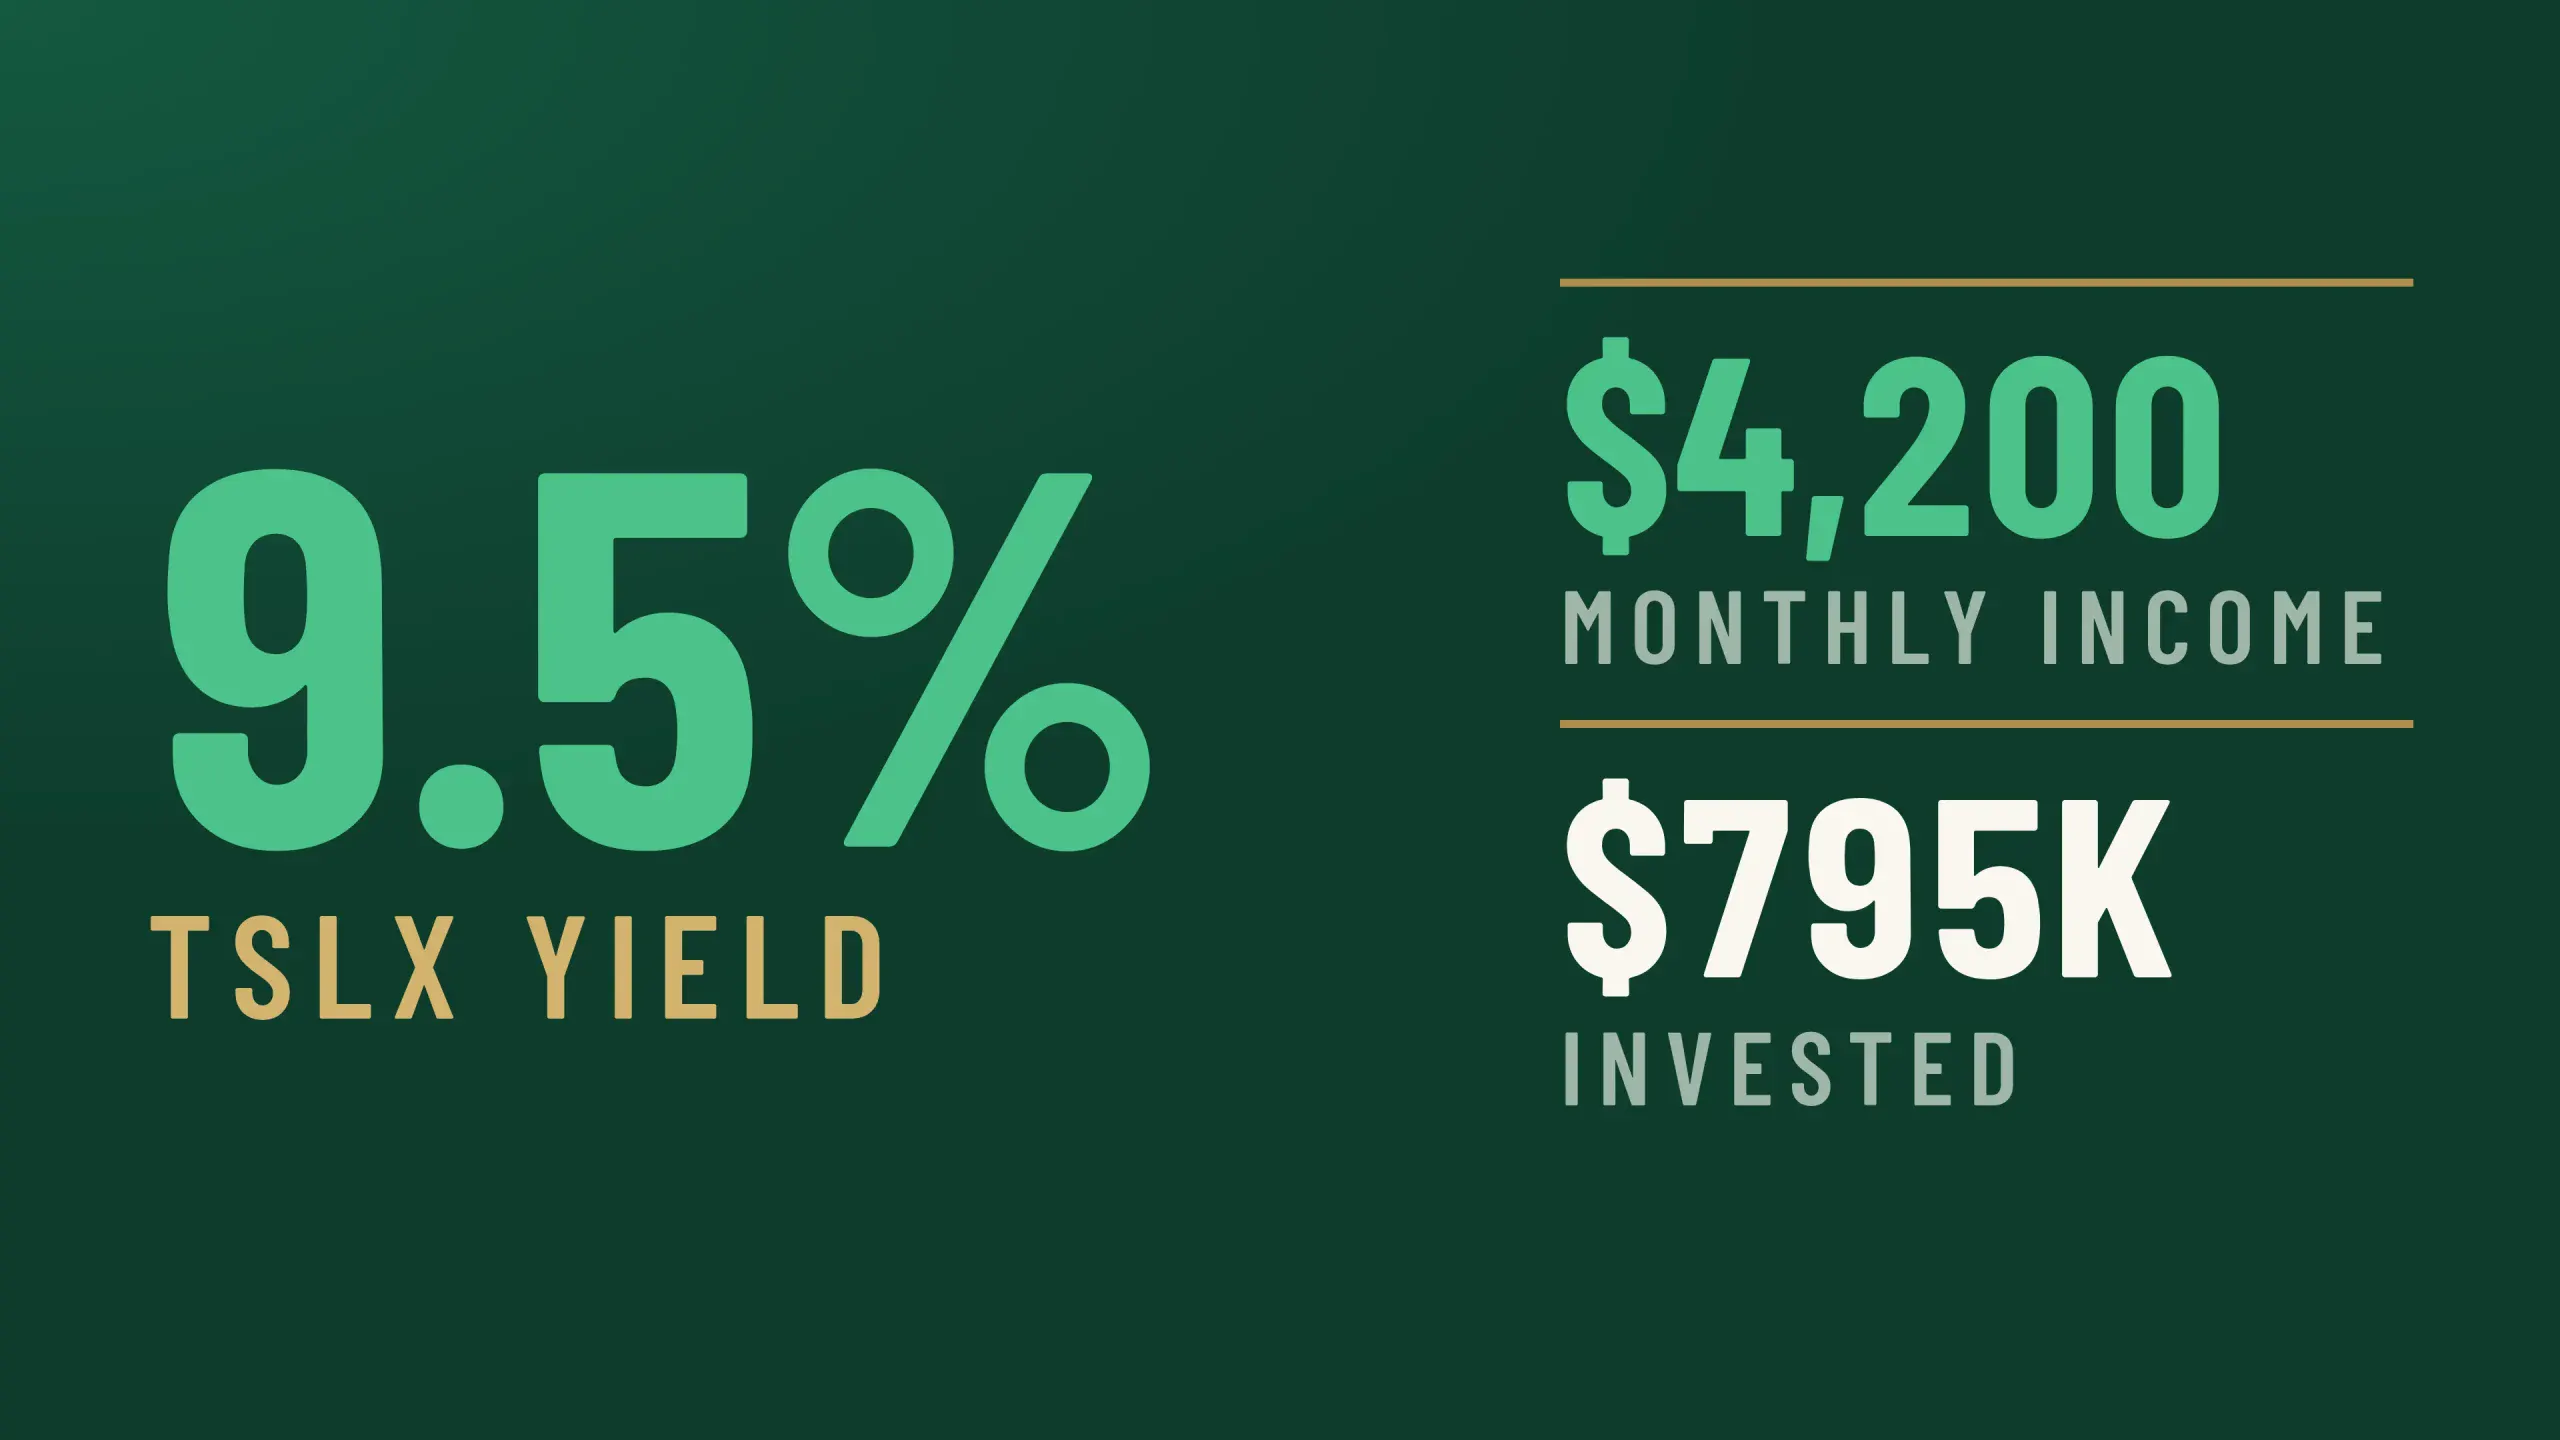 How to Build $4,200 a Month in Dividend Income From Three Income Buckets: SDY, TSLX, and UTG
 Can Nike Just Do It? Analyst Says Turnaround Progress Is Real, but Too Slow
 What's Going On With Accenture Stock Monday?
 Accenture, Google Cloud Advance Automotive AI Software Development With Volvo Cars
 Accenture Rebounds After Friday Selloff as Anthropic Partnership Draws Attention
 What's Going On With Accenture Stock Thursday?
 Accenture Buys McCoy To Accelerate Midmarket AI Expansion
 Billionaire Investor Cuts Tylenol Maker Kenvue Stake By 64%
 What's Going On With Neutrogena Maker Kenvue Stock On Thursday?
 What's Going On With Microchip Technology Stock Monday?
Your note
Sign in to keep a note on SDY — it syncs with the Stock Master app.