

Safran SA SAFRY
82.21 USD +2.99 (+3.77%)
Nov 4, 2026, 1:34 PM EST
81.81 Day range 83.42
75.76 52-week range 104.53
- YTD
- -5.56%
- 1 year
- -7.29%
- Market cap
- 136.11B
- EPS (ttm)
- 2.72
- P/E ratio
- 30.22
- YTD return
- -5.56%
- 1-year return
- -7.29%
- Volume
- 74.56K
- Avg volume
- 224.12K
- Open
- 83.31
- Previous close
- 79.22
- Day's range
- 81.81 – 83.42
- 52-week range
- 75.76 – 104.53
2Y +24.98 (+43.65%)
Earnings
| Report date | Quarter ending | EPS estimate | EPS reported | Surprise | Surprise % |
|---|---|---|---|---|---|
| Jul 28, 2026 | Jun 30, 2026 | 1.43 | 1.23 | -0.20 | -13.99% |
| Feb 13, 2026 | Dec 31, 2025 | 1.27 | 1.10 | -0.17 | -13.39% |
| Jul 31, 2025 | Jun 30, 2025 | 1.12 | 3.55 | +2.43 | +216.96% |
| Feb 14, 2025 | Dec 31, 2024 | 0.888 | -1.71 | -2.60 | -292.85% |
| Jul 31, 2024 | Jun 30, 2024 | 0.605 | 0.14 | -0.46 | -76.86% |
| Feb 15, 2024 | Dec 31, 2023 | 0.761 | 4.07 | +3.31 | +434.82% |
News
 Safran CEO sees appetite from British government to work with Europe
 Rolls-Royce outlook as Safran and GE Aerospace earnings flag aviation risks
 The London Company International Equity 3Q 2026 Top 3 Contributors And Detractors
 Safran SA (SAFRY) Q3 2026 Sales/Trading Call Transcript
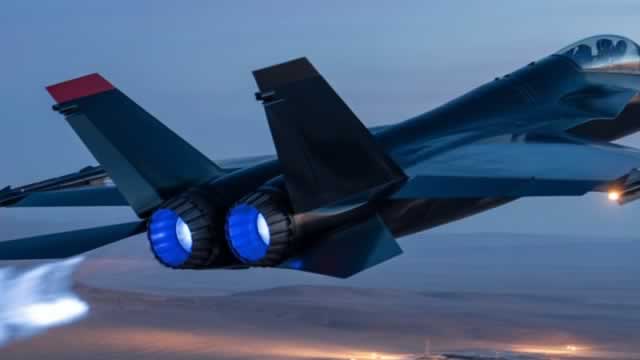 Safran Confirms Guidance as Revenue Jumps
 Safran posts slightly higher than expected Q3 sales
 GE Aerospace JV CFM International Signs MoU With Turkish Airlines To Purchase 300+ LEAP-1B Engines, Including Spares
 Safran: Strong Buy As The Market Overlooks Record Profits
 Safran (OTCMKTS:SAFRY) Share Price Breaks Below Two Hundred Day Moving Average – What’s Next?
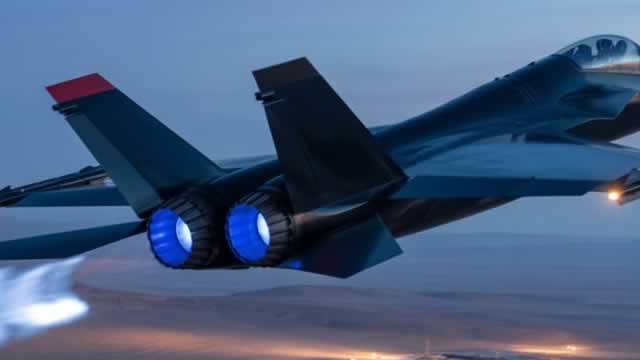 HII or SAFRY: Which Is the Better Value Stock Right Now?
Your note
Sign in to keep a note on SAFRY — it syncs with the Stock Master app.