

Invesco S&P 500 Equal Weight ETF RSP
220.35 USD +4.30 (+1.99%)
Nov 9, 2026, 11:18 AM EST
217.67 Day range 220.36
182.18 52-week range 223.33
- YTD
- +15.03%
- 1 year
- +17.48%
- Market cap
- 101.83B
- EPS (ttm)
- 10.95
- P/E ratio
- 20.11
- YTD return
- +15.03%
- 1-year return
- +17.48%
- Volume
- 4.47M
- Avg volume
- 7.85M
- Open
- 218.40
- Previous close
- 216.05
- Day's range
- 217.67 – 220.36
- 52-week range
- 182.18 – 223.33
1Y +30.65 (+16.25%)
Key statistics
- Enterprise value
- 0
- PEG ratio
- 0.00
- Price / sales
- 0.00
- Price / book
- 0.00
- Dividend yield
- 0.00%
- Payout ratio
- 0.00%
- Revenue growth
- 0.00%
- Free cash flow
- 0
- Total cash
- 0
- Total debt
- 0
- Return on equity
- 0.00%
- Short % of float
- 0.00%
- 50-day average
- 214.89
- 200-day average
- 208.21
Next earnings
Consensus EPS estimate 0.00.
About Invesco S&P 500 Equal Weight ETF
Strictly in accordance with its guidelines and mandated procedures, the index provider compiles, maintains and calculates the underlying index, which consists of all of the of the S&P 500® Index. Under normal circumstances, at least 80% of the value of its net assets, plus the amount of any borrowings for investment purposes, in the components of the underlying index and in derivatives and other investments that have economic characteristics similar to the components of the underlying index.
News
 Five Signals That Preceded Past Recessions Are Back — and AI Is at the Center
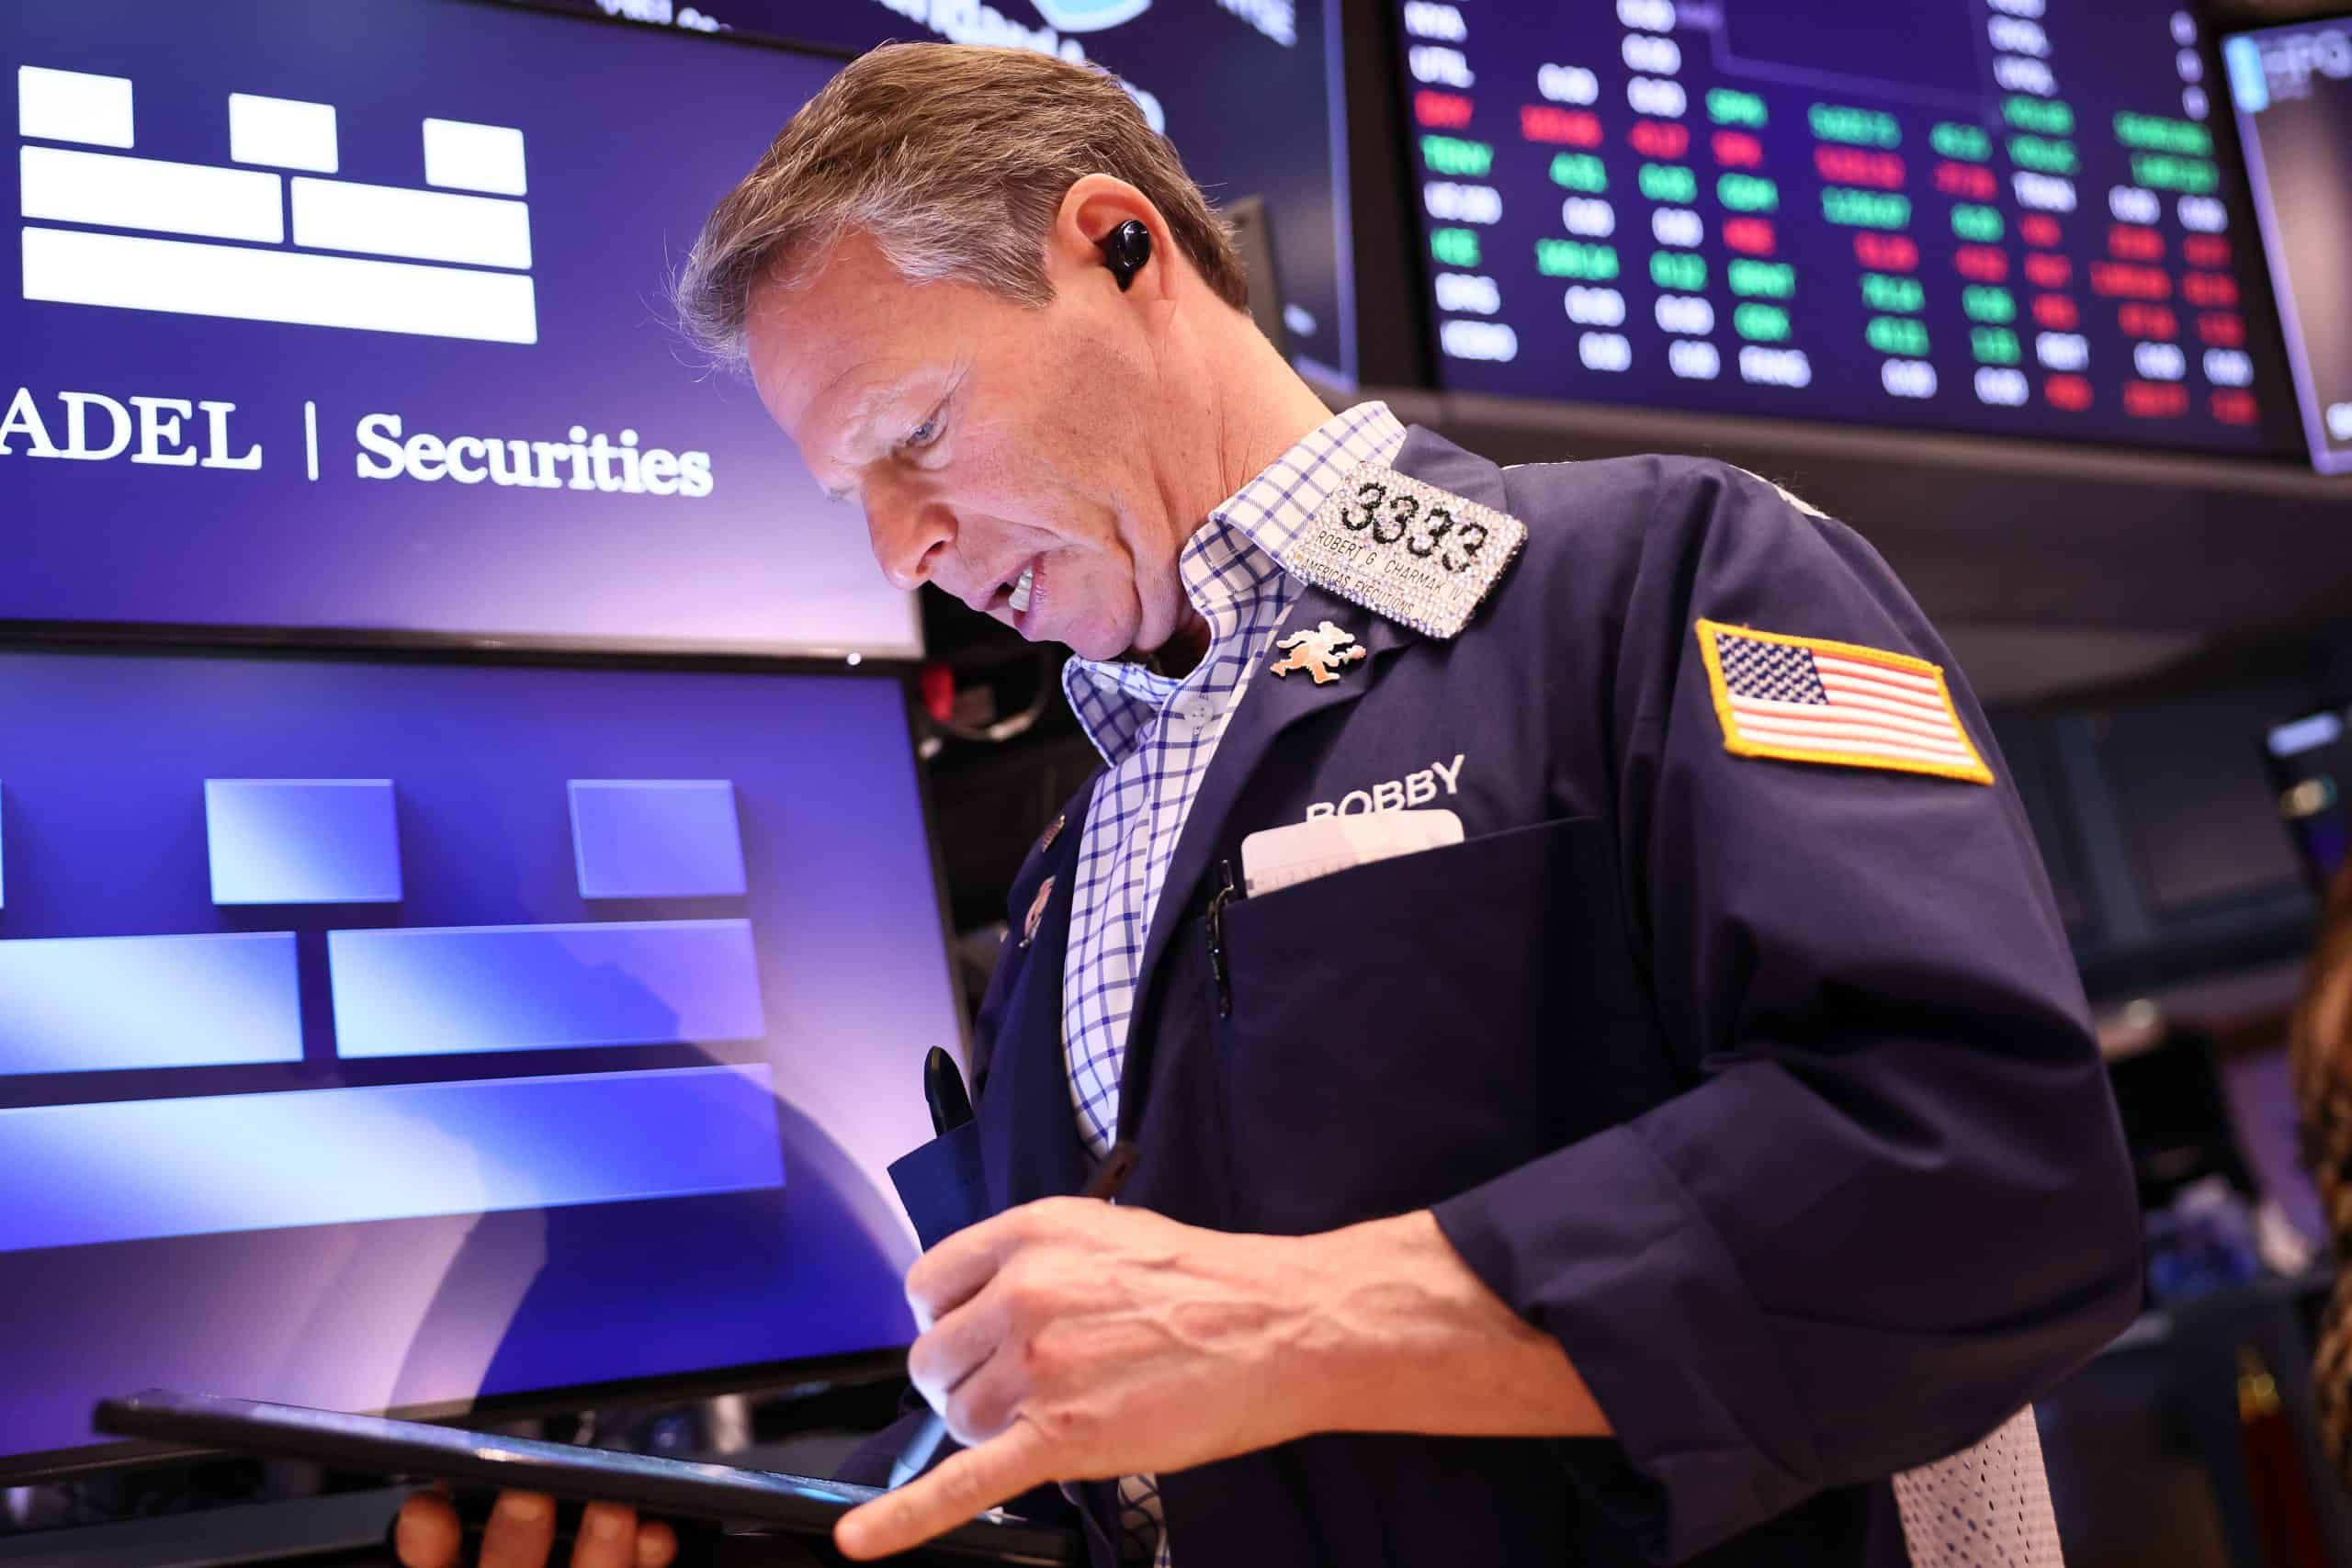 The Dow Just Jumped 1,569 Points for Its Best Post-Midterm Day in 44 Years
 Invesco S&P 500 Equal Weight ETF $RSP Shares Newly Acquired by Basso Capital Management L.P.
 3,337 Invesco S&P 500 Equal Weight ETF $RSP Shares Purchased by Caldwell Trust Co
 BofA Warned About This Exact Election Night in August
 Same 500 Stocks, Different Returns: How Smart Beta Won October
 This Index Just Did Something It Hasn't Done Since 2009. Is It Time To Buy?
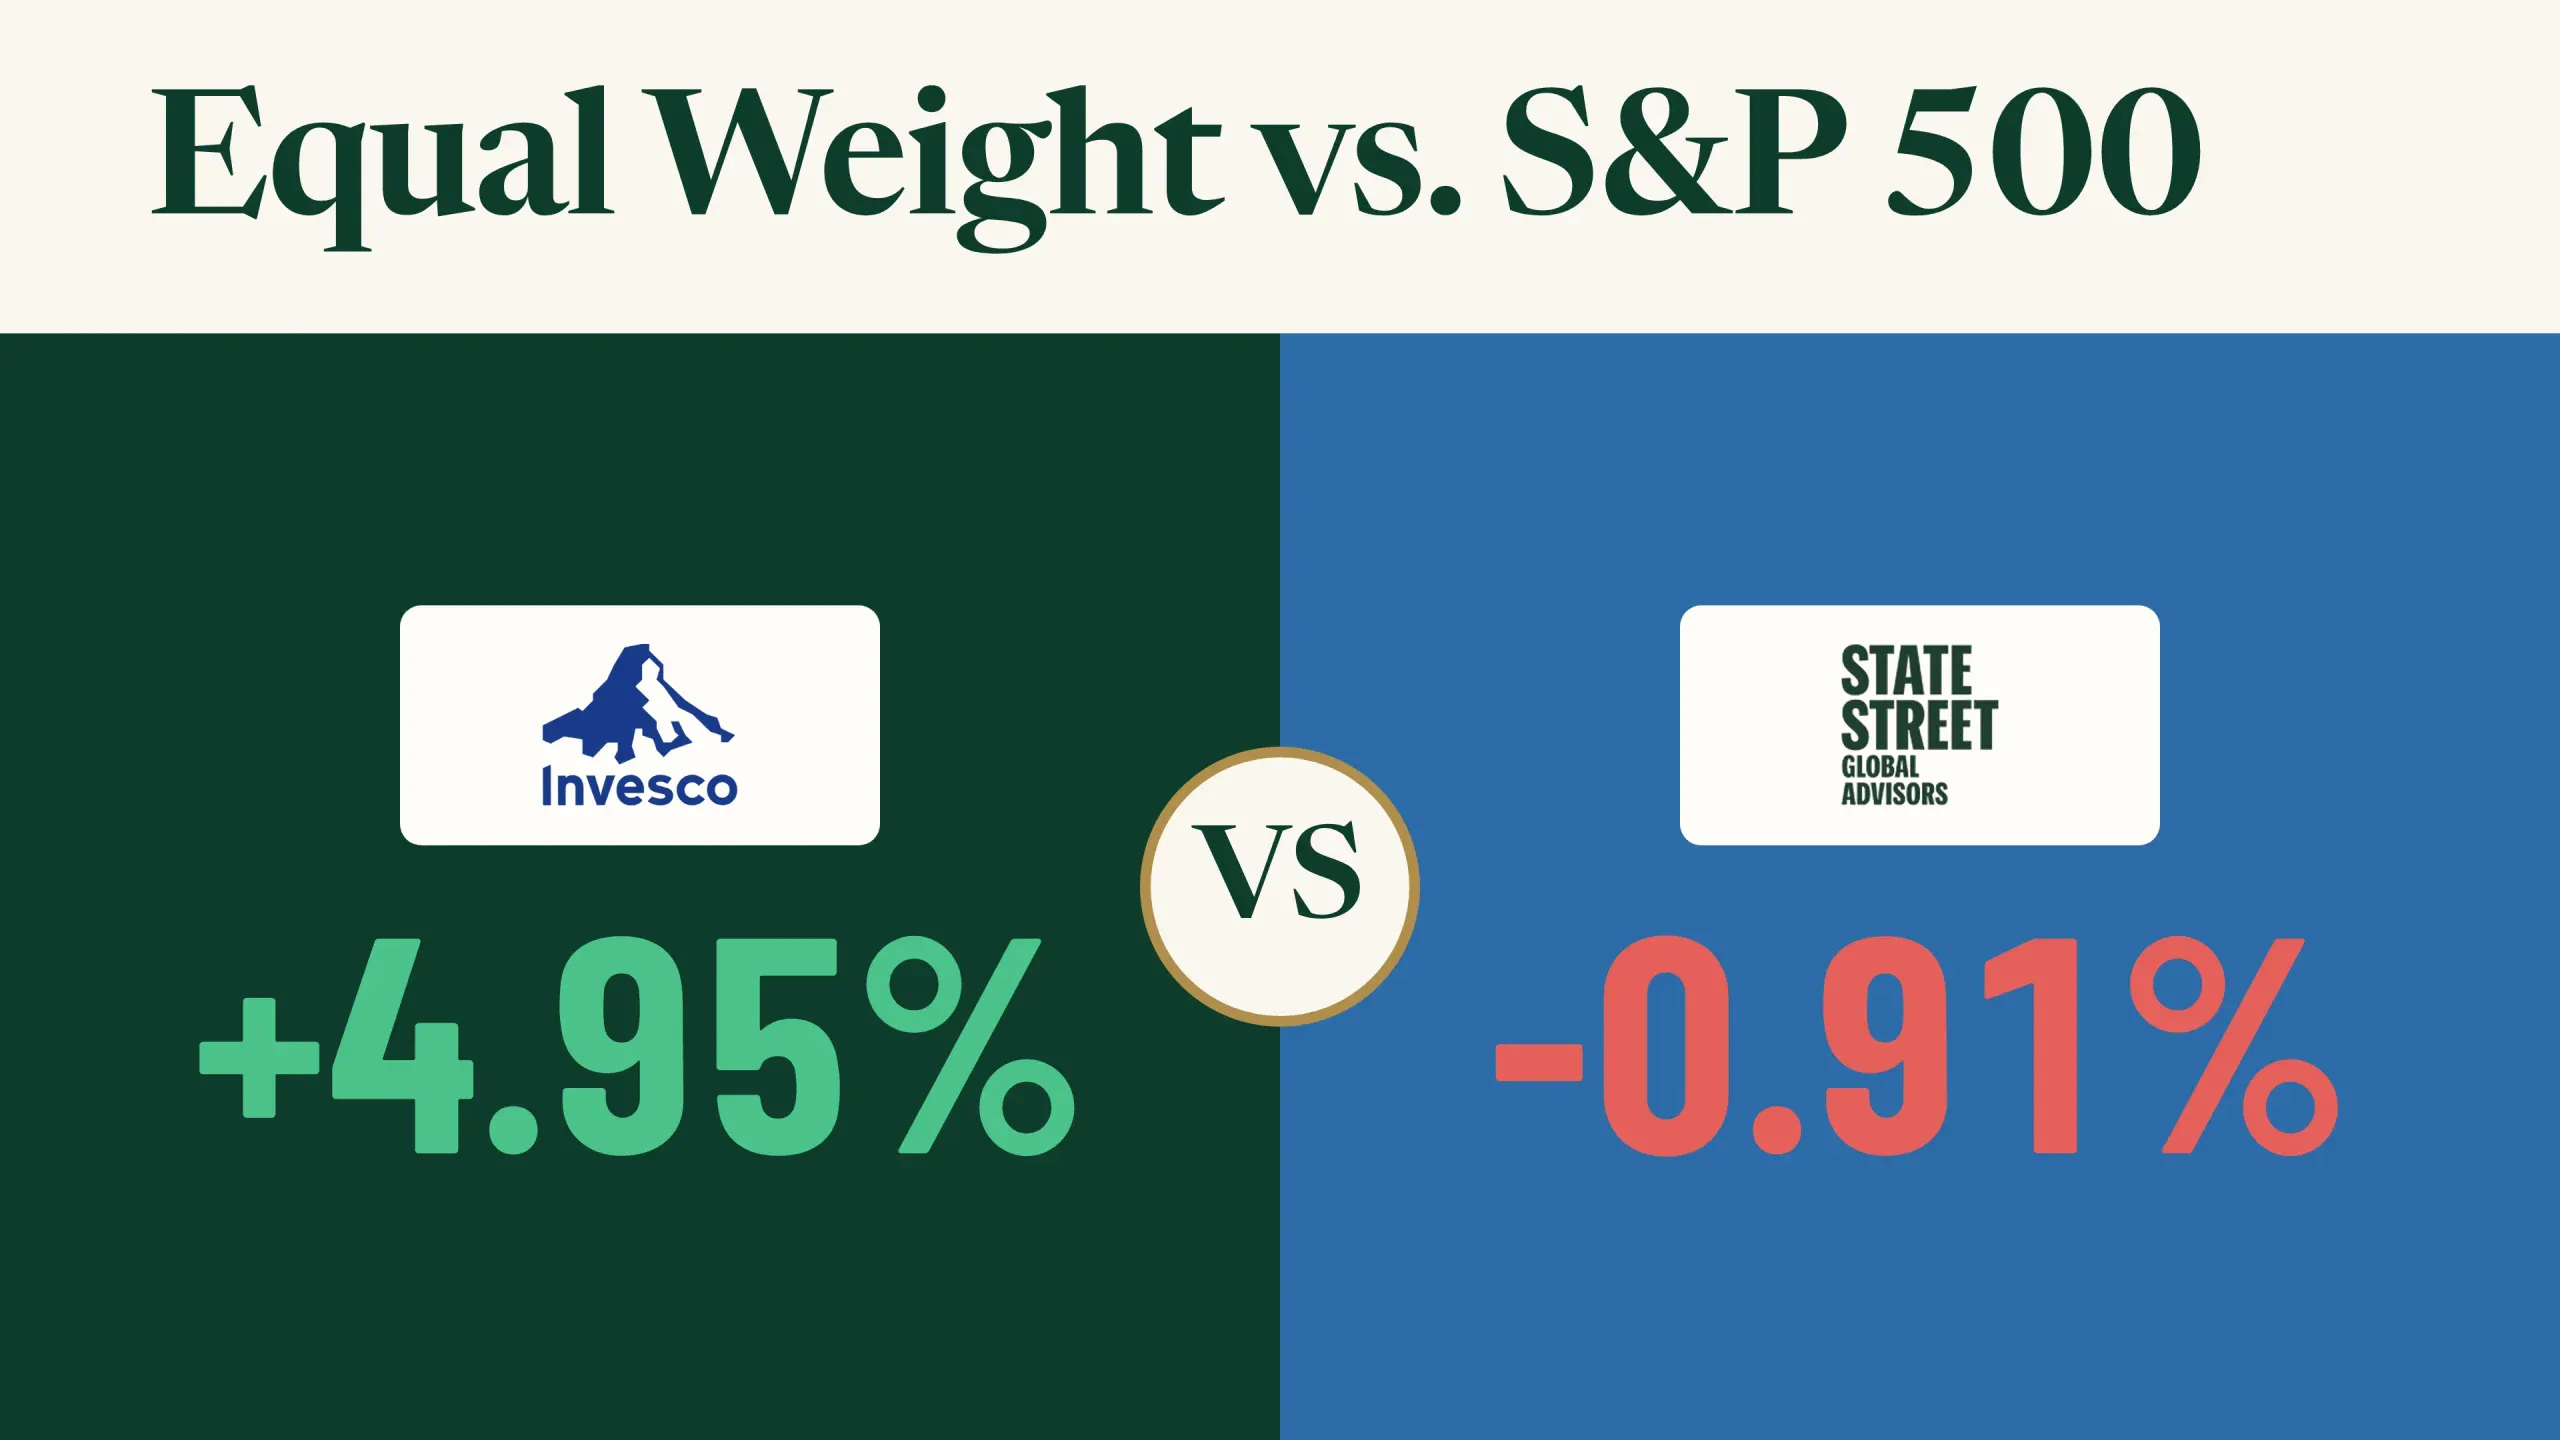 The Average Stock Just Beat the S&P 500 by the Most Since 2009
 UnitedHealth, Cleveland-Cliffs, Regeneron Pharmaceuticals And More: CNBC’s ‘Final Trades’
 Worried About an AI Bubble? This ETF Could Be the Smartest Buy Right Now
Your note
Sign in to keep a note on RSP — it syncs with the Stock Master app.