

Redbox Entertainment Inc. RDBX
Apr 24, 2025, 3:47 PM EDT
52-week range unavailable
- Market cap
- 74.91M
- Revenue (ttm)
- 275.04M
- Profit margin
- -31.65%
- Shares out
- 12.60M
- Forward P/E
- -9.17
- Volume
- 46.36M
- Open
- 2.74
- Previous close
- 1.65
- Day's range
- 1.65 – 2.77
- Analysts
- Hold
- Price target
- 2.17 (+31.5%)
- Earnings date
- Aug 12, 2022
2Y -10.71 (-86.65%)
Key statistics
- Enterprise value
- 291.94M
- PEG ratio
- 0.00
- Price / sales
- 0.27
- Price / book
- 0.00
- Dividend yield
- 0.00%
- Payout ratio
- 0.00%
- Revenue growth
- -17.60%
- Free cash flow
- 3.45M
- Total cash
- 9.76M
- Total debt
- 351.47M
- Return on equity
- 0.00%
- Short % of float
- 53.61%
- 50-day average
- 6.77
- 200-day average
- 6.00
Analyst view
Consensus: hold
- Target (low)
- 0.50
- Target (mean)
- 2.17
- Target (high)
- 5.00
- Strong buy0
- Buy0
- Hold2
- Sell1
- Strong sell0
Next earnings
Aug 12, 2022
Expected Aug 12, 2022. Consensus EPS estimate 0.00.
Financials — quick view
Earnings
| Report date | Quarter ending | EPS estimate | EPS reported | Surprise | Surprise % |
|---|---|---|---|---|---|
| Aug 12, 2022 | Jun 1, 2022 | -0.65 | — | — | — |
Upgrades / downgrades
| Date | Firm | Action | From | To |
|---|---|---|---|---|
| May 27, 2022 | B. Riley Securities | down | Neutral | Sell |
| May 13, 2022 | B. Riley Securities | down | Buy | Neutral |
| Apr 20, 2022 | Canaccord Genuity | main | — | Buy |
| Apr 18, 2022 | B. Riley Securities | main | — | Buy |
| Apr 18, 2022 | BTIG | down | Buy | Neutral |
| Nov 30, 2021 | Wedbush | init | — | Outperform |
About Redbox Entertainment Inc.
Redbox Entertainment Inc. operates a network of self-service kiosks in the United States. It operates a network of approximately 38,000 self-service kiosks, where consumers could rent or purchase new-release DVDs and Blu-ray Discs. The company provides installation, merchandising, and break-fix services to other kiosk businesses. It also produces, acquires, and distributes movies through its film distribution label, Redbox Entertainment, LLC, providing rights to talent-led films that are distributed across the company's services, as well as through third party digital services. In addition, the company offers transactional and ad-supported digital streaming services, which include Redbox On Demand, a transactional service that provides digital rental or purchase of new release and catalog movies and TV content; Redbox Free On Demand, an ad-supported service providing free movies and TV shows on demand; and Redbox Free Live TV, an ad-supported television service giving access to approximately 100 linear channels. The company is based in Oakbrook Terrace, Illinois.
- Sector
- Communication Services
- Industry
- Entertainment
- Country
- United States
- Website
- redbox.com
News
 “Barbie” Comes to Redbox Premium Transactional Video on Demand (TVOD)
 Redbox Expands Popular Perks Program to Transactional Video-on-Demand (TVOD)
 After Q2 Revenue Miss, CEO Of Beleaguered Redbox Parent Says Company Is Ramping Up Cost-Cutting Moves And Weighing Strategic Options; Shares Drop After Hours
 TikTok Teams up With Redbox and Advertising Platform Crackle Connex
 Chicken Soup for the Soul Entertainment's Redbox Transactional Video-on-Demand (TVOD) Service Has the Largest Revenue Week in the Company's History
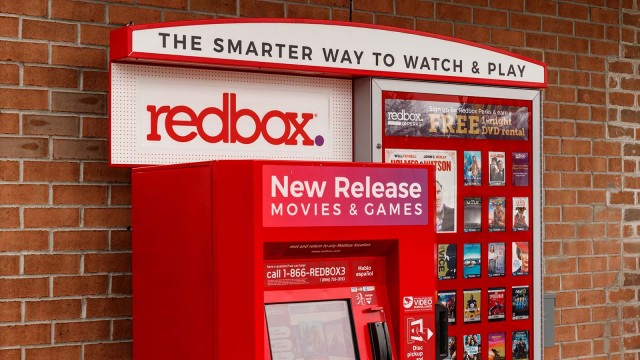 Chicken Soup for the Soul Entertainment (CSSE) Stock Pops as Redbox Deal Closes
 Chicken Soup for the Soul says deal for Redbox is officially completed
 Chicken Soup for the Soul Entertainment Completes Acquisition of Redbox Entertainment Inc.
 Redbox Entertainment (RDBX) Stock: Why It Fell 52.86%
 Chicken Soup for the Soul Entertainment surges again as it closes deal to buy Redbox
Your note
Sign in to keep a note on RDBX — it syncs with the Stock Master app.
Insider holders
| Insider | Relation | Latest transaction | Date | Shares held |
|---|---|---|---|---|
| BURNHAM JAY | Director | Stock Award(Grant) | Dec 26, 2021 | 8,640 |
| CHAMBERLAIN MICHAEL DEAN | Chief Operating Officer | Stock Award(Grant) | Dec 26, 2021 | 172,811 |
| KELLEHER KIMBERLY | Director | Stock Award(Grant) | Dec 26, 2021 | 8,640 |
| KWONG JASON K. | Officer | Stock Award(Grant) | Dec 26, 2021 | 345,622 |
| LAVIN STEPHEN | Chief Technology Officer | Stock Award(Grant) | Dec 26, 2021 | 172,811 |
| PEARLMAN EMANUEL R | Director | Stock Award(Grant) | Mar 9, 2022 | 39,810 |
Institution ownership
| Holder | % held | Shares | Value | Reported |
|---|---|---|---|---|
| Omni Partners US LLC | 9.43% | 1,190,529 | 1.96M | Sep 29, 2021 |
| Standard General L.P. | 7.76% | 979,771 | 1.62M | Mar 30, 2022 |
| Vanguard Group, Inc. (The) | 3.32% | 418,412 | 690.38K | Mar 30, 2022 |
| Geode Capital Management, LLC | 1.16% | 145,869 | 240.68K | Mar 30, 2022 |
| Millennium Management LLC | 0.95% | 119,305 | 196.85K | Mar 30, 2022 |
| B. Riley Asset Management, Llc | 0.64% | 81,008 | 133.66K | Mar 30, 2022 |
Fund ownership
| Holder | % held | Shares | Value | Reported |
|---|---|---|---|---|
| Vanguard Total Stock Market Index Fund | 3.19% | 402,900 | 664.78K | Mar 30, 2022 |
| iShares Russell 2000 ETF | 1.16% | 145,976 | 240.86K | Jun 29, 2022 |
| Bridgeway Funds Inc-Ultra Small Company Market Fund | 0.55% | 70,000 | 115.50K | Mar 30, 2022 |
| iShares Russell 2000 Value ETF | 0.47% | 59,203 | 97.68K | Jun 29, 2022 |
| Fidelity Extended Market Index Fund | 0.41% | 51,985 | 85.78K | May 30, 2022 |
| Fidelity Total Market Index Fund | 0.14% | 17,415 | 28.73K | May 30, 2022 |