

Nomura Energy Transition ETF PWER
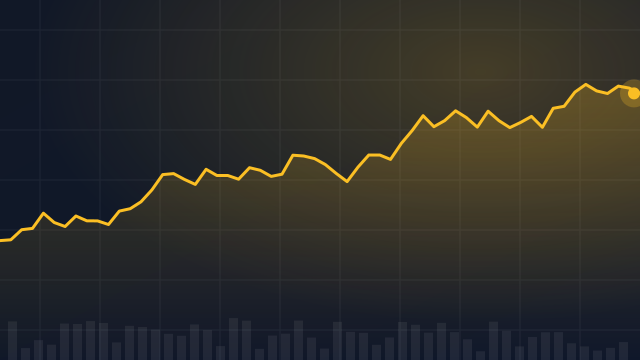
41.86 USD -1.37 (-3.16%)
At closeNov 5, 2026, 4:04 PM EST
41.86 0.00 0.00%
After hours · Nov 5, 4:04 PM ET
41.86 Day range 42.03
31.83 52-week range 47.15
- YTD
- +19.53%
- 1 year
- +28.92%
- Market cap
- 8.69M
- EPS (ttm)
- 2.50
- P/E ratio
- 16.75
- YTD return
- +19.53%
- 1-year return
- +28.92%
- Volume
- 1.95K
- Avg volume
- 1.07K
- Open
- 42.03
- Previous close
- 43.22
- Day's range
- 41.86 – 42.03
- 52-week range
- 31.83 – 47.15
5D -1.69 (-3.88%)
Key statistics
- Enterprise value
- 0
- PEG ratio
- 0.00
- Price / sales
- 0.00
- Price / book
- 0.00
- Dividend yield
- 0.00%
- Payout ratio
- 0.00%
- Short % of float
- 0.00%
- 50-day average
- 28.49
- 200-day average
- 28.21
Financials — quick view
PWER Revenue — quarterly 204.61M
PWER Net income — quarterly -7.16M
PWER EPS — quarterly -0.06
About Nomura Energy Transition ETF
The ETF seeks to achieve its investment objective by investing, under normal circumstances, at least 80% of its net assets, plus the amount of any borrowings for investment purposes, in a diversified portfolio of securities in the energy, materials, industrial, renewable energy, and utilities sectors that meet the fund’s investment criteria.
News
 Nomura Energy Transition ETF (NYSEARCA:PWER) Short Interest Update
 Macquarie Energy Transition ETF (NYSEARCA:PWER) Short Interest Up 222.4% in December
 CF Industries, JERA, Mitsui Form $4 Billion JV To Build Low-Carbon Ammonia Plant In Louisiana
 Generac Poised To Benefit From Blackouts, Declining Grid Reliability: BofA Analyst
 Shell & CNOOC Greenlight Major Petrochemical Expansion In Southern China
 Equinor Powers Up Empire Wind 1 Project With Financing Package: Details
 Alcoa Analyst Boosts Price Target: Growth Strategy Hinges On Kwinana Savings, San Ciprian Resolution
 Alcoa Beats Q3 EPS Expectations, Rides Alumina Price Surge Despite Production Hiccups
 Alcoa Pockets $1.1B From Saudi Joint Venture Sale: Details
- Shell Backs Climate Technology Start-up for Emissions Reduction: Report
Your note
Sign in to keep a note on PWER — it syncs with the Stock Master app.