

Pan American Silver Corp. PAAS
At closeNov 6, 2026, 7:59 PM EST
After hours · Nov 6, 7:59 PM ET
- YTD
- -20.54%
- 1 year
- +21.70%
- Market cap
- 16.98B
- Revenue (ttm)
- 4.46B
- Profit margin
- 35.16%
- EPS (ttm)
- 3.80
- Shares out
- 412.32M
- P/E ratio
- 10.83
- Forward P/E
- 9.62
- Dividend
- 0.74 (1.81%)
- Ex-dividend date
- Aug 23, 2026
- YTD return
- -20.54%
- 1-year return
- +21.70%
- Volume
- 4.64M
- Avg volume
- 4.34M
- Open
- 40.23
- Previous close
- 40.58
- Day's range
- 39.77 – 41.25
- 52-week range
- 33.83 – 68.70
- Beta
- 1.61
- Analysts
- Buy
- Price target
- 60.17 (+46.2%)
- Earnings date
- Feb 17, 2027
1m +1.20 (+3.00%)
Key statistics
- Enterprise value
- 15.88B
- PEG ratio
- 7.02
- Price / sales
- 3.80
- Price / book
- 2.29
- Dividend yield
- 1.81%
- Payout ratio
- 18.00%
- Revenue growth
- 17.70%
- Free cash flow
- 1.36B
- Total cash
- 1.70B
- Total debt
- 844.00M
- Return on equity
- 22.39%
- Short % of float
- 0.00%
- 50-day average
- 46.17
- 200-day average
- 51.45
Analyst view
Consensus: buy
- Target (low)
- 51.00
- Target (mean)
- 60.17
- Target (high)
- 80.00
- Strong buy2
- Buy4
- Hold2
- Sell0
- Strong sell0
Next earnings
Feb 17, 2027
Expected Feb 17, 2027. Consensus EPS estimate 0.85306.
Financials — quick view
Earnings
| Report date | Quarter ending | EPS estimate | EPS reported | Surprise | Surprise % |
|---|---|---|---|---|---|
| Feb 17, 2027 | Dec 30, 2026 | 0.83 | — | — | — |
| Nov 4, 2026 | Sep 30, 2026 | 0.66 | 0.69 | +0.03 | +4.55% |
| Aug 12, 2026 | Jun 30, 2026 | 0.84 | 0.73 | -0.11 | -13.10% |
| May 5, 2026 | Mar 31, 2026 | 1.06 | 1.09 | +0.03 | +2.83% |
| Feb 18, 2026 | Dec 31, 2025 | 0.90 | 1.11 | +0.21 | +23.33% |
| Nov 12, 2025 | Sep 30, 2025 | 0.49 | 0.48 | -0.01 | -2.04% |
Upgrades / downgrades
| Date | Firm | Action | From | To |
|---|---|---|---|---|
| Sep 16, 2026 | RBC Capital | main | Outperform | Outperform |
| Jul 9, 2026 | B of A Securities | main | Buy | Buy |
| Jul 6, 2026 | Jefferies | main | Hold | Hold |
| May 12, 2026 | TD Cowen | up | Hold | Buy |
| Apr 28, 2026 | RBC Capital | reit | Outperform | Outperform |
| Jan 26, 2026 | Scotiabank | main | Sector Outperform | Sector Outperform |
About Pan American Silver Corp.
Pan American Silver Corp. engages in the exploration, mine development, extraction, processing, refining, and reclamation of mines in Chile, Peru, Brazil, Mexico, Canada, Argentina, Bolivia, and Guatemala. The Silver segment includes the La Colorada, Juanicipio, Cerro Moro, Huaron, and San Vicente mines. The Gold segment comprises the Jacobina, El Peñon, Timmins, Shahuindo, Minera Florida, and Dolores mines. It explores silver, gold, zinc, lead, and copper deposits. The company was formerly known as Pan American Minerals Corp. and changed its name to Pan American Silver Corp. in April 1995. Pan American Silver Corp. was incorporated in 1979 and is headquartered in Vancouver, Canada.
- Sector
- Basic Materials
- Industry
- Gold
- Country
- Canada
- Website
- panamericansilver.com
News
 Pan American Silver Q3 2026 Earnings Call Transcript
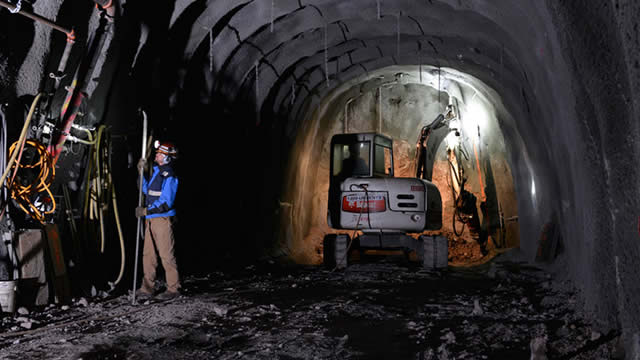 Pan American Silver (PAAS) Q3 Earnings: Taking a Look at Key Metrics Versus Estimates
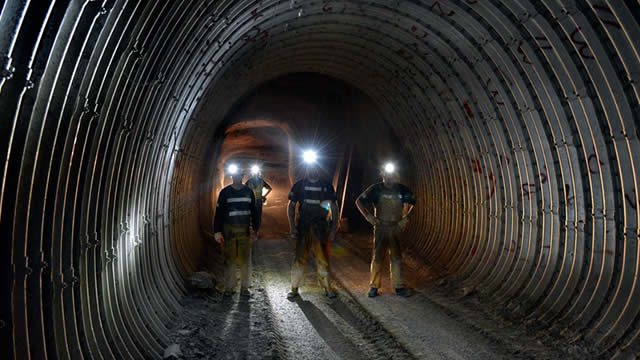 Pan American Silver (PAAS) Surpasses Q3 Earnings Estimates
 Pan American Silver Q3 Adj. EPS $0.69 Misses $1.23 Estimate, Sales $1.006B Miss $1.052B Estimate
 Pan American Silver Reports Third Quarter 2026 Financial Results
 Pan American Silver: Early Warning News Release
 RBC Capital Maintains Outperform on Pan American Silver, Lowers Price Target to $56
 Warsh's Remarks Are Sinking Mining Stocks: Here's Why
 Pan American Silver Q2 2026 Earnings Call Transcript
 Cerebras Systems, Securitize, Stubhub Holdings And Other Big Stocks Moving Lower In Thursday’s Pre-Market Session
Your note
Sign in to keep a note on PAAS — it syncs with the Stock Master app.
Insider holders
| Insider | Relation | Latest transaction | Date | Shares held |
|---|---|---|---|---|
| Andrews (Matthew Robert) | Senior Officer of Issuer | Exercise of rights | Dec 12, 2025 | 31,249 |
| Busby, Steven | Senior Officer of Issuer | Acquisition or disposition in the public market | Jan 4, 2026 | 111,567 |
| De Gelder (Neil) | Director of Issuer | Acquisition or disposition in the public market | Feb 23, 2026 | 39,893 |
| Drier (Ibtissam) | Senior Officer of Issuer | Exercise of options | Jan 11, 2026 | 20,113 |
| Fisher, Delaney Joseph | Senior Officer of Issuer | Acquisition or disposition in the public market | Feb 24, 2026 | 22,093 |
| Lemon (Christopher) | Senior Officer of Issuer | Acquisition or disposition in the public market | Jan 21, 2026 | 17,248 |
Institution ownership
| Holder | % held | Shares | Value | Reported |
|---|---|---|---|---|
| Van Eck Associates Corporation | 4.62% | 19,066,671 | 785.17M | Jun 29, 2026 |
| Mirae Asset Global ETFs Holdings Ltd. | 3.78% | 15,588,063 | 641.92M | Jun 29, 2026 |
| Vanguard Capital Management LLC | 2.79% | 11,523,430 | 474.53M | Jun 29, 2026 |
| Blackrock Inc. | 2.04% | 8,393,564 | 345.65M | Jun 29, 2026 |
| Capital International Investors | 1.51% | 6,236,775 | 256.83M | Jun 29, 2026 |
| NORGES BANK | 1.35% | 5,581,737 | 229.86M | Jun 29, 2026 |
Fund ownership
| Holder | % held | Shares | Value | Reported |
|---|---|---|---|---|
| VanEck ETF Trust-VanEck Gold Miners ETF | 3.77% | 15,555,853 | 640.59M | Sep 29, 2026 |
| GLOBAL X FUNDS-Global X Silver Miners ETF | 2.66% | 10,977,476 | 452.05M | Sep 29, 2026 |
| VANGUARD STAR FUNDS-Vanguard Total International Stock Index Fund | 1.48% | 6,101,071 | 251.24M | Jul 30, 2026 |
| AMERICAN FUNDS INSURANCE SERIES-Eupac Fund | 1.20% | 4,933,845 | 203.18M | Sep 29, 2026 |
| VANGUARD TAX-MANAGED FUNDS-Vanguard Developed Markets Index Fund | 0.98% | 4,037,274 | 166.25M | Jun 29, 2026 |
| New World Fund Inc | 0.66% | 2,726,492 | 112.28M | Sep 29, 2026 |