

Oi S.A. OIBRQ
0.00 USD 0.00 (+0.00%)
At closeAug 31, 2026, 4:00 PM EDT
0.0003 Day range 0.0008
0.0003 52-week range 1.75
- YTD
- -99.96%
- 1 year
- -99.70%
- Market cap
- 966
- EPS (ttm)
- 164.91
- P/E ratio
- 0.00
- YTD return
- -99.96%
- 1-year return
- -99.70%
- Volume
- 2.26K
- Avg volume
- 12
- Open
- 0.0008
- Previous close
- 0.0003
- Day's range
- 0.0003 – 0.0008
- 52-week range
- 0.0003 – 1.75
- Earnings date
- Jan 4, 2023
No chart data for this range yet.
Next earnings
Jan 4, 2023
Expected Jan 4, 2023. Consensus EPS estimate 0.00.
Financials — quick view
OIBRQ Revenue — annual 9.28B
OIBRQ Net income — annual -10.53B
OIBRQ EPS — annual -1.77
Earnings
| Report date | Quarter ending | EPS estimate | EPS reported | Surprise | Surprise % |
|---|---|---|---|---|---|
| Jan 4, 2023 | Sep 1, 2022 | 0.00 | — | — | — |
| Nov 10, 2021 | Sep 1, 2021 | 0.00 | — | — | — |
News
 Oi S.A. (OIBRQ) Q2 2025 Earnings Call Prepared Remarks Transcript
 Oi S.A. (OIBZQ) Q1 2025 Earnings Call Transcript
 Oi S.A. (OIBZQ) Q4 2024 Earnings Call Transcript
 Oi S.A. (OIBZQ) Q2 2024 Earnings Call Transcript
 Oi S.A. (OIBZQ) Q4 2023 Earnings Call Transcript
 Oi S.A. (OIBZQ) Q3 2023 Earnings Call Transcript
 Oi S.A. (OIBZQ) Q2 2023 Earnings Call Transcript
 Oi S.A. (OIBZQ) Q1 2023 Earnings Call Transcript
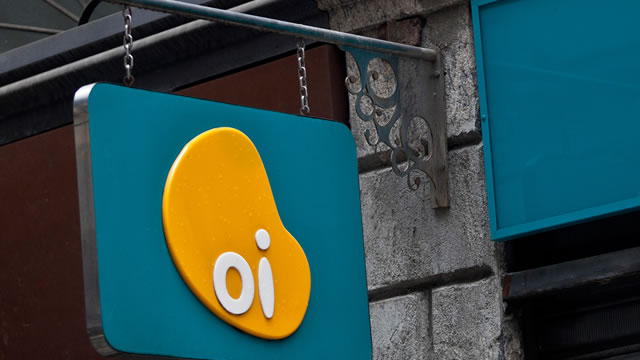 Brazil's Oi postpones release of 2022 financial statements
 Oi S.A. (OIBZQ) Q3 2022 Earnings Call Transcript
Your note
Sign in to keep a note on OIBRQ — it syncs with the Stock Master app.
Dividends
| Ex-dividend date | Amount |
|---|---|
| Oct 7, 2024 | 0.07553 |
| Apr 14, 2022 | 0.027 |
| Jul 20, 2018 | 0.000322 |
| Sep 30, 2013 | 0.27896 |
| Mar 22, 2013 | 0.25287 |
| Aug 20, 2012 | 0.30006 |
Splits
| Date | Ratio |
|---|---|
| Sep 6, 2024 | 1:200 |
| Jan 11, 2023 | 1:10 |
| Dec 29, 2014 | 1:10 |
| Dec 22, 2014 | 1:10 |
| Aug 15, 2012 | 3:1 |
| Mar 30, 2012 | 12582:10000 |