

Oasis Petroleum Inc. OAS
Day range unavailable
52-week range unavailable
- Market cap
- 4.55B
- Revenue (ttm)
- 1.81B
- Profit margin
- 45.78%
- Shares out
- 19.63M
- Forward P/E
- 2.91
- Dividend
- 2.34 (2.14%)
- Ex-dividend date
- Jun 27, 2022
- Analysts
- Buy
- Price target
- 204.83 (+87.4%)
- Earnings date
- Aug 2, 2022
2Y -10.70 (-8.92%)
Key statistics
- Enterprise value
- 2.16B
- PEG ratio
- 1.02
- Price / sales
- 1.18
- Price / book
- 1.48
- Dividend yield
- 2.14%
- Payout ratio
- 14.94%
- Revenue growth
- 99.70%
- Free cash flow
- 41.47M
- Total cash
- 410.17M
- Total debt
- 425.04M
- Return on equity
- 20.98%
- Short % of float
- 10.16%
- 50-day average
- 142.52
- 200-day average
- 132.40
Analyst view
Consensus: buy
- Target (low)
- 157.00
- Target (mean)
- 204.83
- Target (high)
- 236.00
- Strong buy9
- Buy13
- Hold10
- Sell0
- Strong sell0
Next earnings
Aug 2, 2022
Expected Aug 2, 2022. Consensus EPS estimate 6.30.
Earnings
| Report date | Quarter ending | EPS estimate | EPS reported | Surprise | Surprise % |
|---|---|---|---|---|---|
| Aug 2, 2022 | Jun 1, 2022 | 5.68 | — | — | — |
| May 4, 2022 | Mar 1, 2022 | 7.13 | — | — | — |
| Feb 23, 2022 | Dec 1, 2021 | 5.36 | — | — | — |
| Nov 3, 2021 | Sep 1, 2021 | 1.95 | — | — | — |
| Aug 3, 2021 | Jun 1, 2021 | 2.29 | — | — | — |
| May 3, 2021 | Mar 1, 2021 | 2.30 | — | — | — |
Upgrades / downgrades
| Date | Firm | Action | From | To |
|---|---|---|---|---|
| Jul 11, 2022 | Wells Fargo | main | — | Equal-Weight |
| Apr 7, 2022 | Piper Sandler | main | — | Overweight |
| Mar 14, 2022 | Wells Fargo | main | — | Equal-Weight |
| Mar 10, 2022 | Piper Sandler | main | — | Overweight |
| Mar 8, 2022 | MKM Partners | main | — | Buy |
| Mar 1, 2022 | RBC Capital | main | — | Outperform |
About Oasis Petroleum Inc.
As of July 1, 2022, Oasis Petroleum Inc. was acquired by Whiting Petroleum Corporation, in a reverse merger transaction. Oasis Petroleum Inc., an independent exploration and production company, focuses on the acquisition and development of onshore unconventional oil and natural gas resources in the United States. It engages in the acquisition and development of oil and gas properties. As of December 31, 2021, the company had 492,355 net leasehold acres in the Williston Basin. The company sells its crude oil and natural gas to refiners, marketers, and other purchasers that have access to pipeline and rail facilities. Oasis Petroleum Inc. was founded in 2007 and is headquartered in Houston, Texas.
- Sector
- Energy
- Industry
- Oil & Gas E&P
- Country
- United States
- Website
- oasispetroleum.com
News
 Accuray and RaySearch Agree to Collaboration Integrating RayStation Software with Accuray Platforms to Accelerate Accuray's Online Adaptive Capabilities
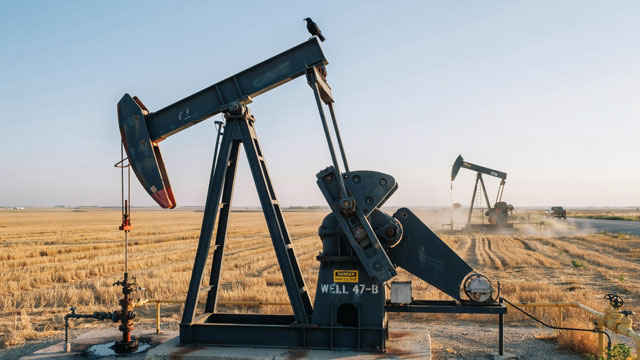 Payroll Boom, Warsh Hawkish, Iran On Fire: The Perfect Storm For FLBL's Leveraged Loans
 Election observers return to Guatemala for ballot review
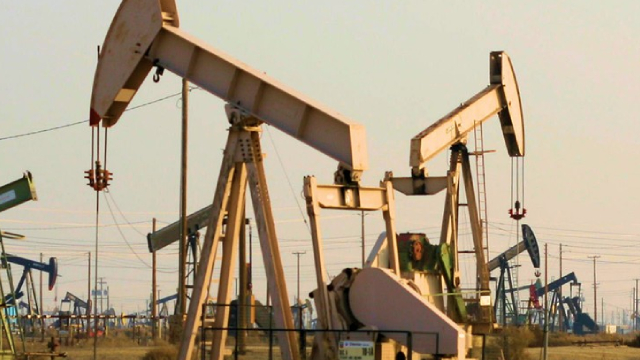 Oasis Petroleum Inc. (OAS) Soars 4.9%: Is Further Upside Left in the Stock?
 Oasis (OAS) Issues Update on Merger, to Pay Special Dividend
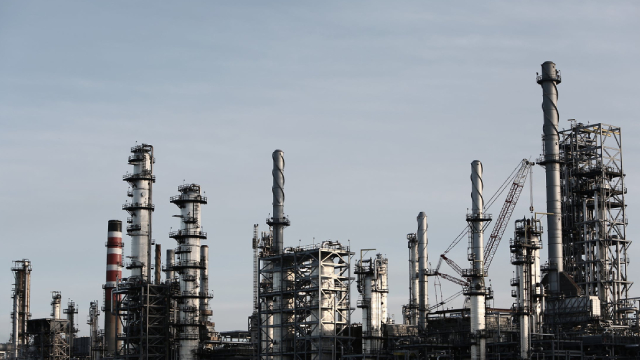 Has Oasis Petroleum (OAS) Outpaced Other Oils-Energy Stocks This Year?
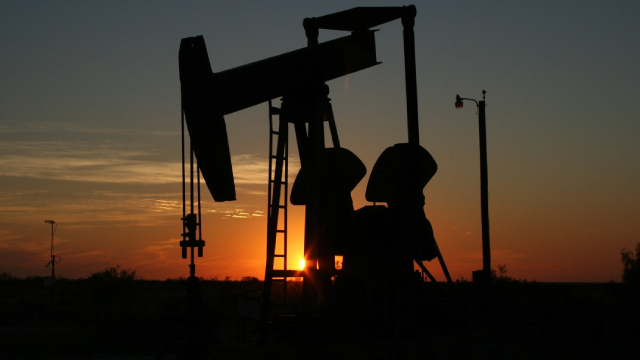 Oasis Petroleum Inc. (OAS) is a Great Momentum Stock: Should You Buy?
 5 Stocks Trading Near 52-Week High That Can Climb Further
 3 Under-the-Radar Energy Stocks With Upcoming Catalysts You Won't Want to Miss
 Tap 5 Bargain Stocks With Amazingly Low EV-to-EBITDA Ratios
Your note
Sign in to keep a note on OAS — it syncs with the Stock Master app.
Insider holders
| Insider | Relation | Latest transaction | Date | Shares held |
|---|---|---|---|---|
| BROOKS DOUGLAS E | Director | Purchase | Nov 1, 2021 | 19,985 |
| BROWN DANIEL E | Chief Executive Officer | Stock Award(Grant) | Apr 12, 2021 | 43,975 |
| HOLROYD SAMANTHA | Director | Sale | May 30, 2022 | 14,000 |
| LANCASTER N JOHN JR | Director | Stock Award(Grant) | Dec 28, 2020 | 15,500 |
| LORENTZATOS NICKOLAS J | General Counsel | Stock Award(Grant) | Jan 17, 2021 | 16,776 |
| LOU MICHAEL H | Chief Financial Officer | Stock Award(Grant) | Jan 17, 2021 | 27,632 |
Institution ownership
| Holder | % held | Shares | Value | Reported |
|---|---|---|---|---|
| Vanguard Group, Inc. (The) | 9.19% | 1,804,275 | 197.21M | Mar 30, 2022 |
| JP Morgan Chase & Company | 8.89% | 1,745,292 | 190.76M | Mar 30, 2022 |
| Blackrock Inc. | 7.49% | 1,470,748 | 160.75M | Mar 30, 2022 |
| Fuller & Thaler Asset Management Inc. | 4.99% | 979,745 | 107.09M | Mar 30, 2022 |
| State Street Corporation | 4.80% | 941,653 | 102.92M | Mar 30, 2022 |
| Kimmeridge Energy Management Company, LLC | 4.45% | 873,679 | 95.49M | Mar 30, 2022 |
Fund ownership
| Holder | % held | Shares | Value | Reported |
|---|---|---|---|---|
| Capitol Ser Tr-Fuller & Thaler Behavioral Small Cap Equity Fd | 4.68% | 918,846 | 100.43M | Apr 29, 2022 |
| Vanguard Total Stock Market Index Fund | 2.68% | 525,586 | 57.45M | Mar 30, 2022 |
| SPDR (R) Ser Tr-SPDR (R) S&P (R) Oil & Gas Explor & Prod ETF | 2.61% | 513,114 | 56.08M | May 30, 2022 |
| Fidelity Low-Priced Stock Fund | 2.47% | 484,511 | 52.96M | Apr 29, 2022 |
| Vanguard Small-Cap Index Fund | 2.34% | 459,062 | 50.18M | Mar 30, 2022 |
| American High-Income Trust | 2.29% | 450,000 | 49.19M | Mar 30, 2022 |