

Realty Income Corporation O
At closeNov 10, 2026, 7:56 PM EST
After hours · Nov 10, 7:56 PM ET
- YTD
- +5.62%
- 1 year
- +5.60%
- Market cap
- 56.78B
- Revenue (ttm)
- 6.22B
- Profit margin
- 21.81%
- EPS (ttm)
- 1.46
- Shares out
- 951.00M
- P/E ratio
- 40.78
- Forward P/E
- 38.33
- Dividend
- 3.26 (5.48%)
- Ex-dividend date
- Oct 29, 2026
- YTD return
- +5.62%
- 1-year return
- +5.60%
- Volume
- 3.86M
- Avg volume
- 7.41M
- Open
- 59.19
- Previous close
- 59.50
- Day's range
- 58.92 – 59.79
- 52-week range
- 53.15 – 67.94
- Beta
- 0.65
- Analysts
- Hold
- Price target
- 63.25 (+6.2%)
- Earnings date
- Feb 23, 2027
5D +1.21 (+2.07%)
Key statistics
- Enterprise value
- 91.47B
- PEG ratio
- 2.98
- Price / sales
- 9.13
- Price / book
- 1.43
- Dividend yield
- 5.48%
- Payout ratio
- 222.26%
- Revenue growth
- 10.20%
- Free cash flow
- 1.63B
- Total cash
- 403.13M
- Total debt
- 32.11B
- Return on equity
- 3.48%
- Short % of float
- 4.59%
- 50-day average
- 57.05
- 200-day average
- 61.56
Analyst view
Consensus: hold
- Target (low)
- 59.00
- Target (mean)
- 63.25
- Target (high)
- 74.00
- Strong buy1
- Buy6
- Hold17
- Sell0
- Strong sell1
Next earnings
Feb 23, 2027
Expected Feb 23, 2027. Consensus EPS estimate 0.43472.
Financials — quick view
Earnings
| Report date | Quarter ending | EPS estimate | EPS reported | Surprise | Surprise % |
|---|---|---|---|---|---|
| Feb 23, 2027 | Dec 30, 2026 | 0.422 | — | — | — |
| Nov 2, 2026 | Sep 30, 2026 | 0.4068 | 0.43 | +0.02 | +5.70% |
| Aug 5, 2026 | Jun 30, 2026 | 0.3977 | 0.37 | -0.03 | -6.97% |
| May 6, 2026 | Mar 31, 2026 | 0.4026 | 0.33 | -0.07 | -18.03% |
| Feb 24, 2026 | Dec 31, 2025 | 0.3835 | 0.32 | -0.06 | -16.56% |
| Nov 3, 2025 | Sep 30, 2025 | 0.4045 | 0.345 | -0.06 | -14.71% |
Upgrades / downgrades
| Date | Firm | Action | From | To |
|---|---|---|---|---|
| Nov 10, 2026 | Truist Securities | main | Hold | Hold |
| Nov 5, 2026 | Cantor Fitzgerald | main | Neutral | Neutral |
| Nov 3, 2026 | RBC Capital | main | Outperform | Outperform |
| Oct 20, 2026 | Barclays | main | Equal-Weight | Equal-Weight |
| Oct 19, 2026 | Wells Fargo | main | Equal-Weight | Equal-Weight |
| Oct 19, 2026 | Mizuho | main | Neutral | Neutral |
About Realty Income Corporation
Realty Income Corporation, an S&P 500 company, is real estate partner to the world's leading companies. Founded in 1969, they serve their clients as a full-service real estate capital provider. As of June 30, 2026, they have a portfolio of over 15,500 properties in all 50 U.S. states, the U.K., and eight other countries in Europe. They are known as (The Monthly Dividend Company) and have a mission to invest in people and places to deliver dependable monthly dividends that increase over time. Since their founding, they have declared 676 consecutive monthly dividends and are a member of the S&P 500 Dividend Aristocrats index for having increased dividend for over 31 consecutive years. Realty Income Corporation was founded in 1969 and was incorporated in Maryland.
- Sector
- Real Estate
- Industry
- REIT - Retail
- Country
- United States
- Website
- realtyincome.com
News
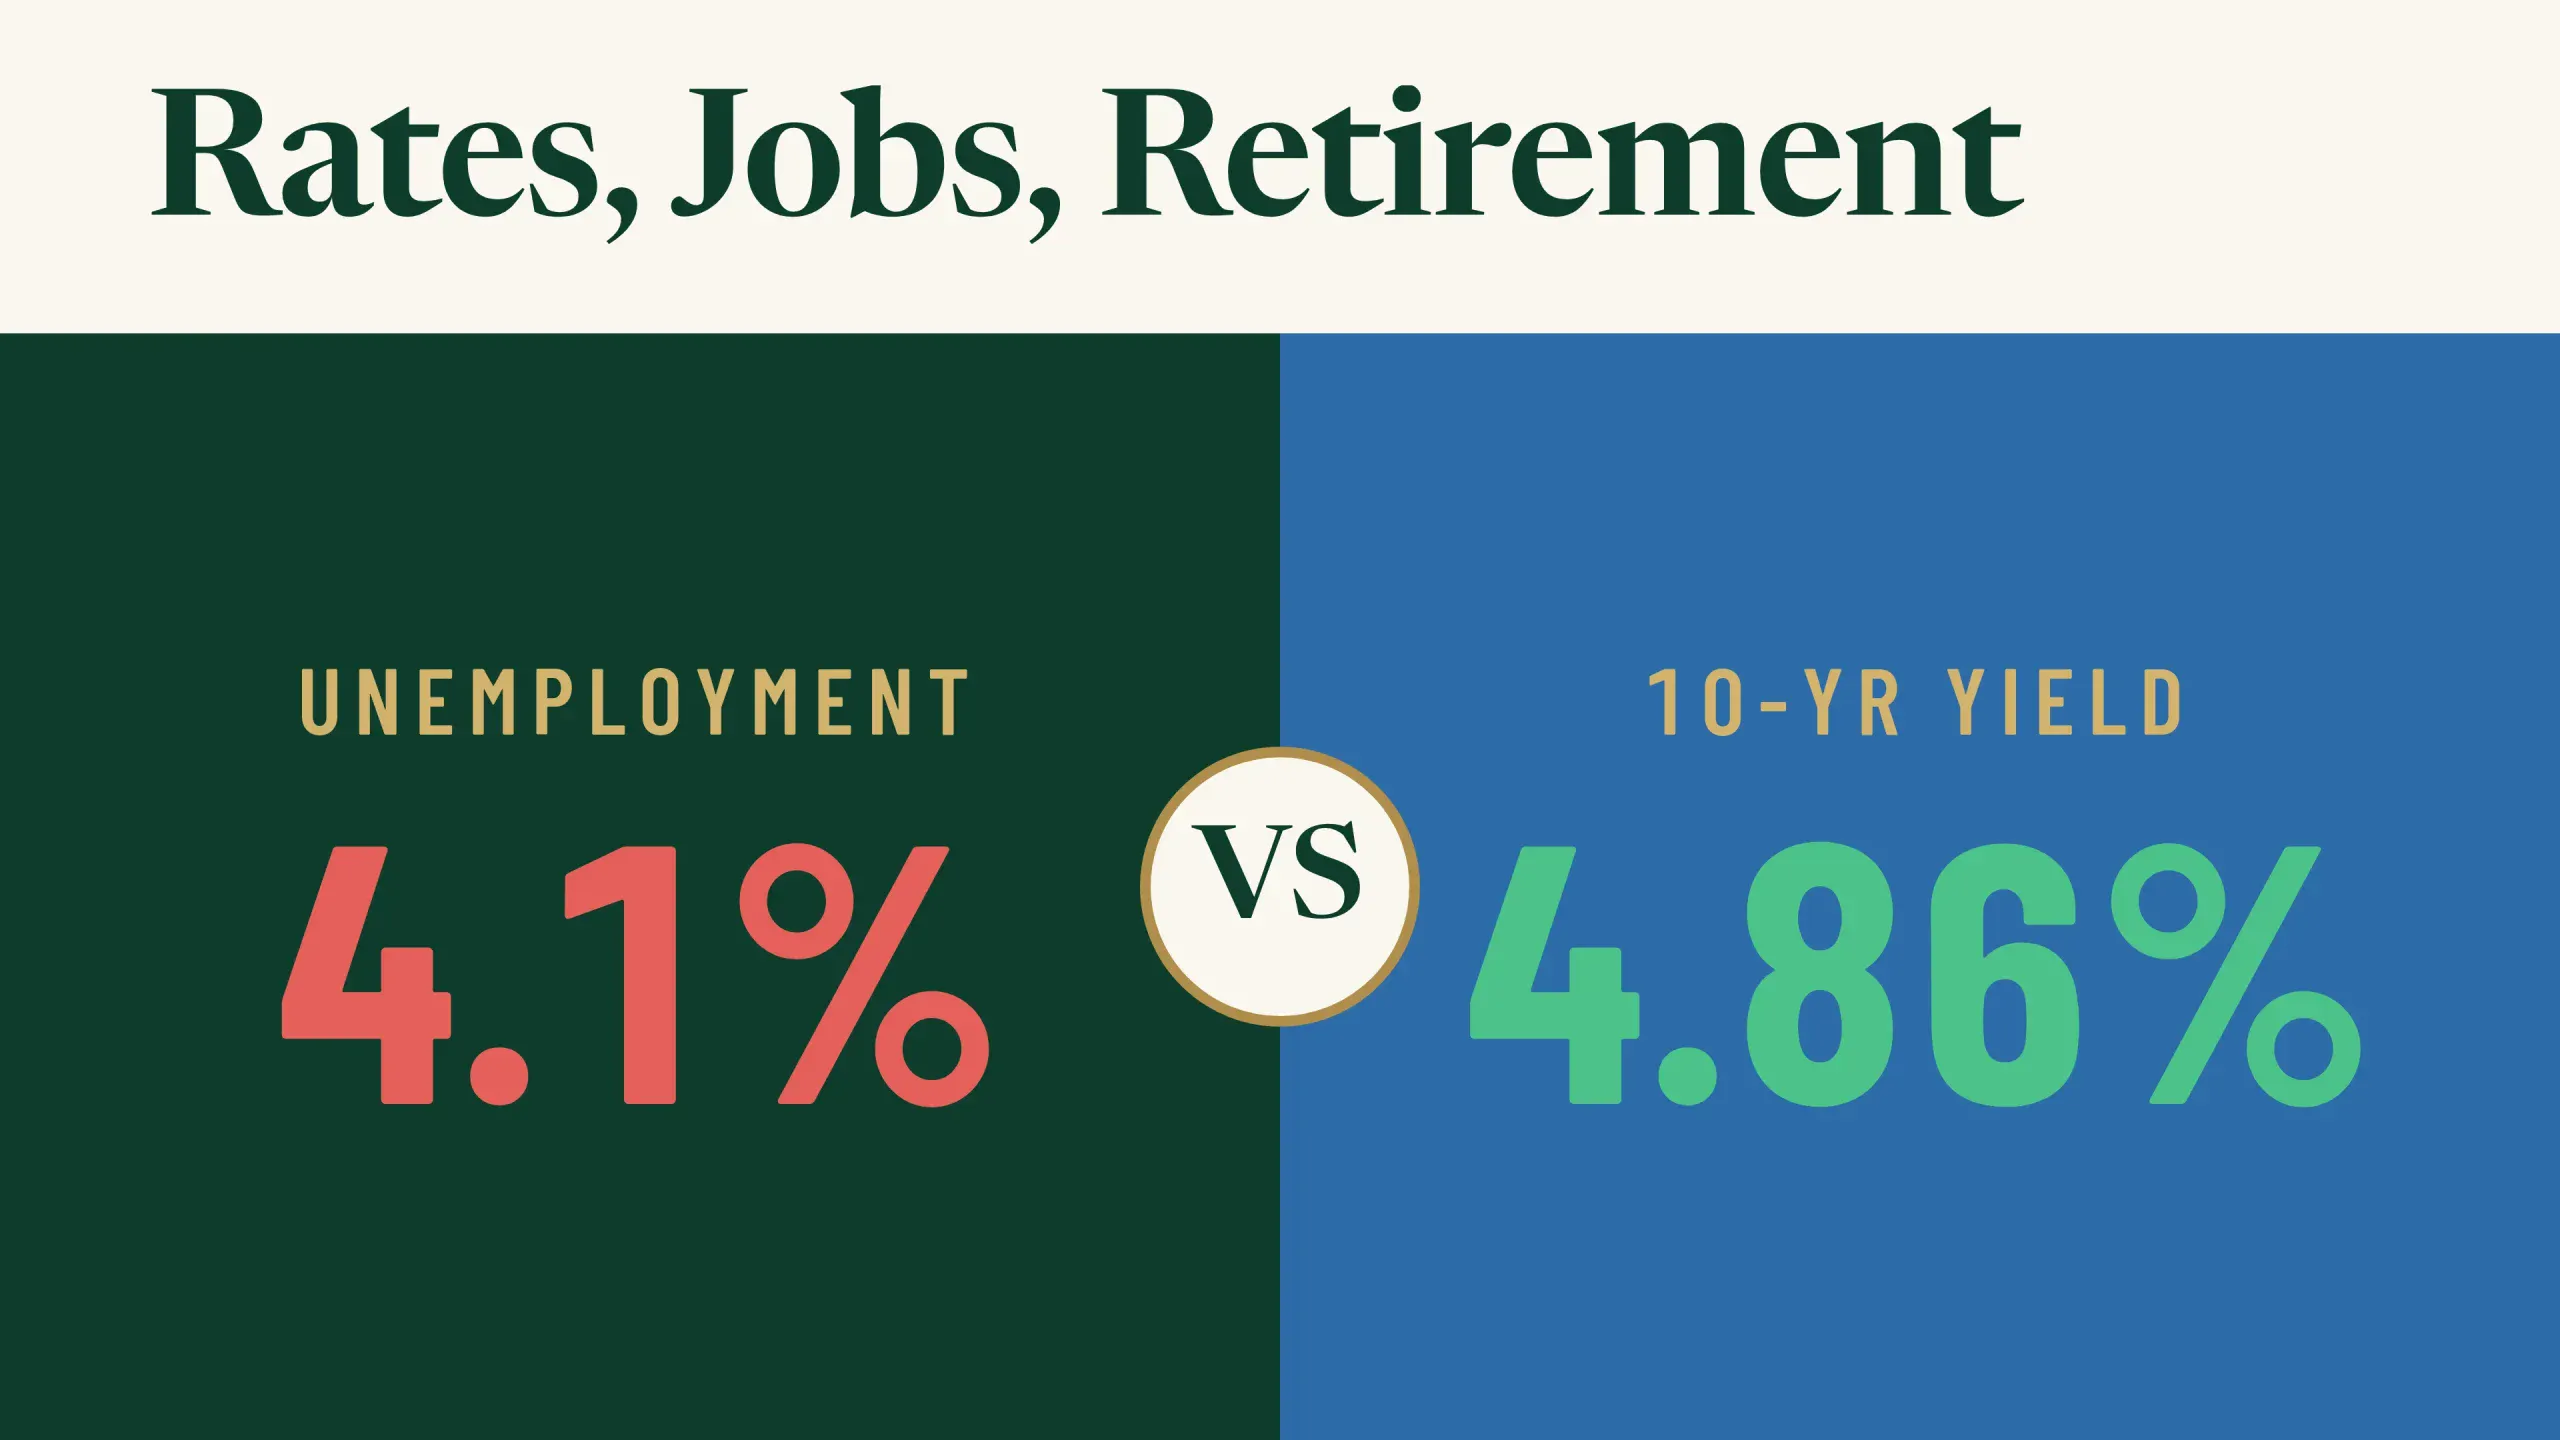 Matthew Hornbach Says Falling Unemployment Is the Real Risk to Higher Rates. Here’s Why Retirees Should Care
 137th Common Stock Monthly Dividend Increase Declared by Realty Income
 Treasuries Now Offer 2.66% Above Inflation. Are Dividend Stocks in Trouble?
 How Much Do You Need at 63 to Replace a $190,000 Salary With Dividends?
 Truist Securities Maintains Hold on Realty Income, Raises Price Target to $63
 Democrats Take Congress: 4 Dividend Stocks From Oil to Telecom Worth Buying
 5 High Yield REITs That Pay You Tax Free Inside a Roth
 $400,000 in Dividend Stocks: How a Roth IRA Could Save You $3,780 a Year
 3 Monthly Dividend Stocks That Could Help Pay Your Retirement Bills
 4 High-Yield Dividend Stocks You Can Buy Today and Hold Forever
Your note
Sign in to keep a note on O — it syncs with the Stock Master app.
Insider holders
| Insider | Relation | Latest transaction | Date | Shares held |
|---|---|---|---|---|
| ABRAHAM NEIL M | Officer | Stock Award(Grant) | Feb 16, 2026 | 103,548 |
| BUSHORE MICHELLE | General Counsel | Sale | Apr 1, 2026 | 67,641 |
| GILYARD REGINALD HAROLD | Director | Stock Award(Grant) | May 20, 2026 | 34,846 |
| HAGAN MARK E. | Chief Investment Officer | Stock Award(Grant) | Feb 16, 2026 | 109,288 |
| HUSKINS PRIYA CHERIAN | Director | Stock Award(Grant) | May 20, 2026 | 0 |
| LOPEZ GERARDO I | Director | Stock Award(Grant) | May 20, 2026 | 34,846 |
Institution ownership
| Holder | % held | Shares | Value | Reported |
|---|---|---|---|---|
| Blackrock Inc. | 11.88% | 112,931,238 | 6.72B | Jun 29, 2026 |
| Vanguard Portfolio Management LLC | 8.74% | 83,115,805 | 4.95B | Jun 29, 2026 |
| State Street Corporation | 6.93% | 65,929,425 | 3.93B | Jun 29, 2026 |
| Vanguard Capital Management LLC | 6.40% | 60,848,009 | 3.62B | Jun 29, 2026 |
| Geode Capital Management, LLC | 3.38% | 32,146,487 | 1.91B | Sep 29, 2026 |
| Mizuho Securities USA LLC | 2.45% | 23,290,708 | 1.39B | Sep 29, 2026 |
Fund ownership
| Holder | % held | Shares | Value | Reported |
|---|---|---|---|---|
| VANGUARD SPECIALIZED FUNDS-Vanguard Real Estate Index Fund | 3.70% | 35,201,054 | 2.10B | Jul 30, 2026 |
| VANGUARD INDEX FUNDS-Vanguard Total Stock Market Index Fund | 3.11% | 29,600,189 | 1.76B | Jun 29, 2026 |
| VANGUARD INDEX FUNDS-Vanguard 500 Index Fund | 2.54% | 24,169,828 | 1.44B | Jun 29, 2026 |
| VANGUARD INDEX FUNDS-Vanguard Mid-Cap Index Fund | 2.12% | 20,204,974 | 1.20B | Jun 29, 2026 |
| iShares Trust-iShares Core S&P 500 ETF | 1.33% | 12,608,571 | 750.65M | Sep 29, 2026 |
| Fidelity Concord Street Trust-Fidelity 500 Index Fund | 1.29% | 12,297,020 | 732.10M | Sep 29, 2026 |