

Novo Nordisk A/S NVO
Nov 4, 2026, 10:18 AM EST
- YTD
- -16.07%
- 1 year
- -11.49%
- Market cap
- 187.70B
- Revenue (ttm)
- 329.43B
- Profit margin
- 35.35%
- EPS (ttm)
- 4.09
- Shares out
- 3.34B
- P/E ratio
- 10.41
- Forward P/E
- 11.69
- Dividend
- 1.80 (2.13%)
- Ex-dividend date
- Aug 16, 2026
- YTD return
- -16.07%
- 1-year return
- -11.49%
- Volume
- 10.19M
- Avg volume
- 12.12M
- Open
- 42.45
- Previous close
- 40.19
- Day's range
- 42.12 – 43.24
- 52-week range
- 35.29 – 63.98
- Beta
- 0.37
- Price target
- 45.10 (+5.6%)
- Earnings date
- Nov 4, 2026
30m +4.03 (+10.41%)
Key statistics
- Enterprise value
- 274.26B
- PEG ratio
- 4.55
- Price / sales
- 0.54
- Price / book
- 5.36
- Dividend yield
- 4.44%
- Payout ratio
- 45.09%
- Revenue growth
- 2.10%
- Free cash flow
- 37.67B
- Total cash
- 44.98B
- Total debt
- 140.13B
- Return on equity
- 59.81%
- Short % of float
- 1.18%
- 50-day average
- 41.11
- 200-day average
- 44.11
Analyst view
- Target (low)
- 39.75
- Target (mean)
- 45.10
- Target (high)
- 61.79
- Strong buy0
- Buy3
- Hold10
- Sell1
- Strong sell0
Next earnings
Nov 4, 2026
Expected Nov 4, 2026. Consensus EPS estimate 4.62.
Financials — quick view
Earnings
| Report date | Quarter ending | EPS estimate | EPS reported | Surprise | Surprise % |
|---|---|---|---|---|---|
| Nov 4, 2026 | Sep 30, 2026 | 0.731 | — | — | — |
| Aug 5, 2026 | Jun 30, 2026 | 0.82 | 0.96 | +0.14 | +17.07% |
| May 6, 2026 | Mar 31, 2026 | 0.87 | 1.04 | +0.17 | +19.54% |
| Feb 3, 2026 | Dec 31, 2025 | 0.90 | 1.00 | +0.10 | +11.11% |
| Nov 5, 2025 | Sep 30, 2025 | 0.77 | 1.02 | +0.25 | +32.47% |
| Aug 6, 2025 | Jun 30, 2025 | 0.93 | 0.97 | +0.04 | +4.30% |
Upgrades / downgrades
| Date | Firm | Action | From | To |
|---|---|---|---|---|
| Oct 12, 2026 | BMO Capital | main | Market Perform | Market Perform |
| Sep 11, 2026 | Morgan Stanley | down | Equal-Weight | Underweight |
| Mar 2, 2026 | Goldman Sachs | down | Buy | Neutral |
| Feb 24, 2026 | JP Morgan | down | Overweight | Neutral |
| Jan 9, 2026 | CICC | init | — | Outperform |
| Dec 8, 2025 | Argus Research | down | Buy | Hold |
About Novo Nordisk A/S
Novo Nordisk A/S, together with its subsidiaries, engages in the research and development, manufacture, and distribution of pharmaceutical products. It operates through two segments, Obesity and Diabetes Care, and Rare Disease. The Obesity and Diabetes care segment provides products for diabetes, obesity, cardiovascular, and other emerging therapy areas. The Rare Disease segment offers products in the areas of rare blood disorders, rare endocrine disorders, and hormone replacement therapy. The company also provides NovoPen 6 and NovoPen Echo Plus, smart insulin pens; Dose Check, an insulin dose guidance application; growth hormone pens and injection needles; and Wegovy pill an oral glucagon-like peptide-1 (GLP-1) receptor agonist therapy for weight management. The company has a collaboration with Anthropic accelerate the development of new medicines and advance AI-driven software development. It operates in Europe, Canada, the United States, Japan, Korea, Oceania, Southeast Asia, Mainland China, Hong Kong and Taiwan, Latin America, the Middle East, and Africa. It has a strategic collaboration with Orbis Medicines to discover and develop oral macrocycle therapeutics for cardiometabolic diseases. The company was formerly known as Novo Industri A/S and changed its name to Novo Nordisk A/S in April 1989. The company was founded in 1923 and is headquartered in Bagsvaerd, Denmark.
- Sector
- Healthcare
- Industry
- Drug Manufacturers - General
- Country
- Denmark
- Website
- novonordisk.com
News
 Stock Market Today: Dow Jones, S&P 500, Nasdaq 100 Futures Rise as Democrats Take Control of Congress—AMD, AMGN, NVO in Focus (UPDATED)
 Novo Nordisk Raises 2026 Outlook As Wegovy Pill Shines
 Novo Nordisk Q3: Just The Report I Was Waiting For
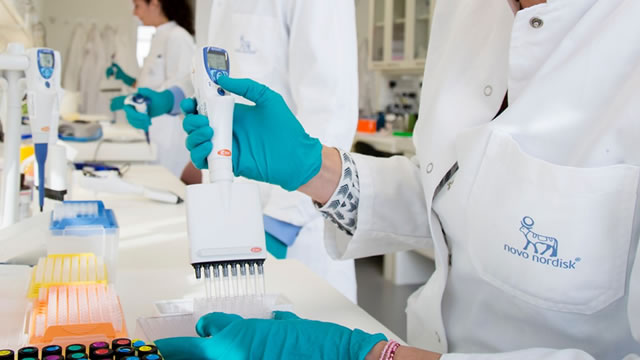 2 Reasons for Hope From Novo Nordisk Earnings
 Beleaguered Novo offers relief to investors, thanks to Wegovy pill
 Novo Nordisk Lifts Guidance as Rollout of Wegovy Weight-Loss Pill Continues
 Novo Nordisk's CFO Karsten Munk Knudsen to leave company
 Novo Nordisk Q3 Adj. EPS $0.87 Beats $0.81 Estimate, Sales $11.900B Beat $11.390B Estimate
 Novo raises full-year outlook as Wegovy sales impress
 Novo Nordisk Q3 profit beats forecast; raises 2026 guidance
Your note
Sign in to keep a note on NVO — it syncs with the Stock Master app.
Institution ownership
| Holder | % held | Shares | Value | Reported |
|---|---|---|---|---|
| Dodge & Cox Inc. | 0.60% | 20,397,110 | 820.37M | Jun 29, 2026 |
| LOOMIS SAYLES & CO L P | 0.55% | 18,594,352 | 747.86M | Jun 29, 2026 |
| Franklin Resources, Inc. | 0.38% | 13,041,109 | 524.51M | Jun 29, 2026 |
| Price (T.Rowe) Associates Inc | 0.35% | 11,704,719 | 470.76M | Jun 29, 2026 |
| Morgan Stanley | 0.34% | 11,659,869 | 468.96M | Jun 29, 2026 |
| Bank of America Corporation | 0.33% | 11,176,712 | 449.53M | Jun 29, 2026 |
Fund ownership
| Holder | % held | Shares | Value | Reported |
|---|---|---|---|---|
| Dodge & Cox Funds-Dodge & Cox Stock Fund | 0.45% | 15,240,800 | 612.98M | Jun 29, 2026 |
| PUTNAM LARGE CAP VALUE FUND | 0.24% | 7,975,159 | 320.76M | Jul 30, 2026 |
| WASHINGTON MUTUAL INVESTORS FUND | 0.16% | 5,338,458 | 214.71M | Sep 29, 2026 |
| LOOMIS SAYLES FUNDS II-Loomis Sayles Growth Fund | 0.15% | 5,111,619 | 205.59M | Jun 29, 2026 |
| AMERICAN BALANCED FUND | 0.14% | 4,750,000 | 191.05M | Sep 29, 2026 |
| TR PRICE-Price (T.Rowe) International Growth Equity Trust | 0.10% | 3,454,365 | 138.93M | Jun 29, 2026 |