

NEC Corporation NIPNF
30.90 USD +1.64 (+5.60%)
At closeNov 3, 2026, 4:00 PM EST
30.99 Day range 30.99
21.65 52-week range 41.00
- YTD
- -3.50%
- 1 year
- -15.73%
- Market cap
- 41.02B
- EPS (ttm)
- 1.50
- P/E ratio
- 20.60
- YTD return
- -3.50%
- 1-year return
- -15.73%
- Volume
- 5
- Avg volume
- 625
- Open
- 30.99
- Previous close
- 29.26
- Day's range
- 30.99 – 30.99
- 52-week range
- 21.65 – 41.00
- Earnings date
- Nov 3, 2026
2Y -53.74 (-64.75%)
Next earnings
Nov 3, 2026
Expected Nov 3, 2026. Consensus EPS estimate 0.2824.
Earnings
| Report date | Quarter ending | EPS estimate | EPS reported | Surprise | Surprise % |
|---|---|---|---|---|---|
| Nov 3, 2026 | Sep 30, 2026 | 0.2824 | — | — | — |
| Jul 29, 2026 | Jun 30, 2026 | 0.1187 | 0.2304 | +0.11 | +94.10% |
| Apr 28, 2026 | Mar 31, 2026 | 0.568 | 0.606 | +0.04 | +6.69% |
| Jan 29, 2026 | Dec 31, 2025 | 0.3136 | 0.3324 | +0.02 | +5.99% |
| Oct 29, 2025 | Sep 30, 2025 | 0.2255 | 0.2715 | +0.05 | +20.40% |
| Jul 29, 2025 | Jun 30, 2025 | 0.03886 | 0.1005 | +0.06 | +158.62% |
News
 NEC Corporation (NECPY) Q2 2027 Earnings Call Prepared Remarks Transcript
 Critical Comparison: NEC (OTCMKTS:NIPNF) and Globant (NYSE:GLOB)
 NEC Announces Ohio Attorney General's Office Upgrade to Integra-ID® 7 Software-as-a-Service Biometric Platform
 First Bellwether Trial Today Against Reckitt Benckiser's Mead Johnson in NEC Baby Formula MDL Led by Levin Papantonio
 NEC Corporation (NECPY) Discusses Progress and Strategic Priorities in Midterm Management Plan Briefing Prepared Remarks Transcript
 NEC CORPORATION OF AMERICA Announces Western Identification Network (WIN) Upgrade to Latest Integra-ID® 7 Cloud Platform
 Trial Set in NEC Multidistrict Litigation Against Reckitt Benckiser's Mead Johnson Led by Levin Papantonio
 Netcracker and NEC Implement Critical BSS Functions for Leading Japanese Operator KDDI
 NEC to Acquire CSG, Strengthening Its Position as a Global Leader in Digital Transformation
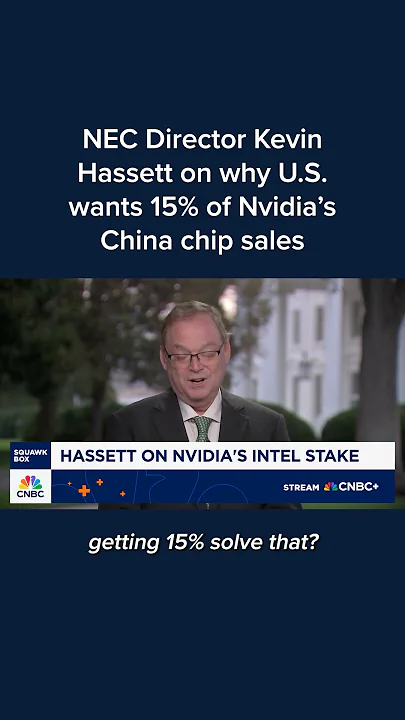 NEC Director Kevin Hassett on why U.S. wants 15% of Nvidia's China chip sales
Your note
Sign in to keep a note on NIPNF — it syncs with the Stock Master app.