

Stocksnips AI-Powered Sentiment US ALL Cap ETF NEWZ
29.39 USD -0.90 (-2.98%)
At closeNov 5, 2026, 4:00 PM EST
29.34 -0.05 -0.16%
After hours · Nov 5, 4:00 PM ET
29.39 Day range 29.71
26.02 52-week range 30.89
- YTD
- +8.16%
- 1 year
- +3.04%
- Market cap
- 21.59M
- EPS (ttm)
- 1.56
- P/E ratio
- 18.82
- YTD return
- +8.16%
- 1-year return
- +3.04%
- Volume
- 3.00K
- Avg volume
- 1.80K
- Open
- 29.71
- Previous close
- 30.29
- Day's range
- 29.39 – 29.71
- 52-week range
- 26.02 – 30.89
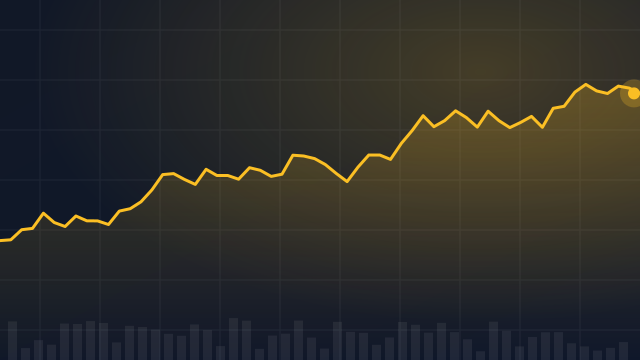
1m -0.32 (-1.08%)
Financials — quick view
NEWZ Revenue — quarterly 16.42M
NEWZ Net income — quarterly 138.00K
NEWZ EPS — quarterly 0.01
News
 Zoom Introduces Customizable AI Companion With New Add-Ons For Businesses
 AIEQ: An Example Of AI Failure
 Seagate Reports Solid Q2, Analyst Optimistic About Advanced HAMR Technology Impact In 2025
 Seagate Ramps Up Technology For AI, Delivers Profitable Growth In Q2
 Seagate Technology Falls Despite Q1 Earnings Beat And Rising Margins
Your note
Sign in to keep a note on NEWZ — it syncs with the Stock Master app.