

Micron Technology, Inc. MU
At closeNov 10, 2026, 4:13 AM EST
Pre-market · Nov 10, 4:13 AM ET
- YTD
- +156.88%
- 1 year
- +208.15%
- Market cap
- 829.50B
- Revenue (ttm)
- 133.19B
- Profit margin
- 63.80%
- EPS (ttm)
- 74.33
- Shares out
- 1.13B
- P/E ratio
- 9.86
- Forward P/E
- 3.53
- Dividend
- 0.60 (0.09%)
- Ex-dividend date
- Oct 13, 2026
- YTD return
- +156.88%
- 1-year return
- +208.15%
- Volume
- 31.81M
- Avg volume
- 27.78M
- Open
- 703.59
- Previous close
- 690.00
- Day's range
- 689.65 – 744.74
- 52-week range
- 192.59 – 1,255.00
- Beta
- 2.40
- Analysts
- Strong Buy
- Price target
- 1,561.91 (+113.0%)
- Earnings date
- Dec 23, 2026
5D -136.60 (-15.71%)
Key statistics
- Enterprise value
- 742.43B
- PEG ratio
- 0.16
- Price / sales
- 6.23
- Price / book
- 5.99
- Dividend yield
- 0.09%
- Payout ratio
- 0.71%
- Revenue growth
- 379.30%
- Free cash flow
- 29.14B
- Total cash
- 43.43B
- Total debt
- 5.18B
- Return on equity
- 88.26%
- Short % of float
- 2.00%
- 50-day average
- 961.64
- 200-day average
- 756.73
Analyst view
Consensus: strong buy
- Target (low)
- 361.00
- Target (mean)
- 1,561.91
- Target (high)
- 3,000.00
- Strong buy9
- Buy36
- Hold4
- Sell0
- Strong sell0
Next earnings
Dec 23, 2026
Expected Dec 23, 2026. Consensus EPS estimate 38.29.
Financials — quick view
Earnings
| Report date | Quarter ending | EPS estimate | EPS reported | Surprise | Surprise % |
|---|---|---|---|---|---|
| Dec 23, 2026 | Dec 3, 2026 | 38.20 | — | — | — |
| Sep 30, 2026 | Sep 3, 2026 | 31.77 | 33.42 | +1.65 | +5.19% |
| Jun 24, 2026 | May 28, 2026 | 20.98 | 25.11 | +4.13 | +19.69% |
| Mar 18, 2026 | Feb 26, 2026 | 9.19 | 12.20 | +3.01 | +32.75% |
| Dec 17, 2025 | Nov 27, 2025 | 3.96 | 4.78 | +0.82 | +20.71% |
| Sep 23, 2025 | Aug 28, 2025 | 2.86 | 3.03 | +0.17 | +5.94% |
Upgrades / downgrades
| Date | Firm | Action | From | To |
|---|---|---|---|---|
| Oct 22, 2026 | Rosenblatt | main | Buy | Buy |
| Oct 22, 2026 | Needham | reit | Buy | Buy |
| Oct 13, 2026 | Rosenblatt | main | Buy | Buy |
| Oct 7, 2026 | DA Davidson | main | Buy | Buy |
| Oct 1, 2026 | Mizuho | main | Outperform | Outperform |
| Oct 1, 2026 | Morgan Stanley | reit | Overweight | Overweight |
About Micron Technology, Inc.
Micron Technology, Inc. engages in the provision of semiconductor memory and storage products in the United States, Taiwan, Mainland China, other Asia Pacific countries, Japan, Europe, and internationally. It operates through Cloud Memory Business Unit, Core Data Center Business Unit, Mobile and Client Business Unit, and Automotive and Embedded Business Unit segments. The company provides dynamic random access memory (DRAM) products, including High-Bandwidth Memory, doublie data rate, low-power DRAM, and graphics DRAM products; NAND products comprising solid state drives, managed NAND, and multi-chip packages; and NOR products. The company sells its products under the Micron brand name and private labels through its own direct sales force, sales or representative offices, as well as through distributors, retailers, and independent sales representatives. Micron Technology, Inc. was founded in 1978 and is headquartered in Boise, Idaho.
- Sector
- Technology
- Industry
- Semiconductors
- Country
- United States
- Website
- micron.com
News
 Why Is Marvell Stock Surging on Monday?
 What Is Going on With Taiwan Semiconductor Stock on Monday?
 Congressional Trading Report: Rep. John McGuire Sold Over $1K In Western Digital Stock
 Chip Stocks Are 38% Off Their Peak: 'Time to Buy the Dip,' Analysts Say
 Nasdaq Gains Over 1% as Chipmakers Recover: Investor Sentiment Improves, but Fear & Greed Index Remains in ‘Extreme Fear’ Zone
 Should Investors Buy the S&P 500 Dip After Wall Street's $3 Trillion Rout Last Week? History Points to a Rebound
 Analysts Question AAPL's Valuation, Apple's Margin Pressure and More: This Week in Appleverse
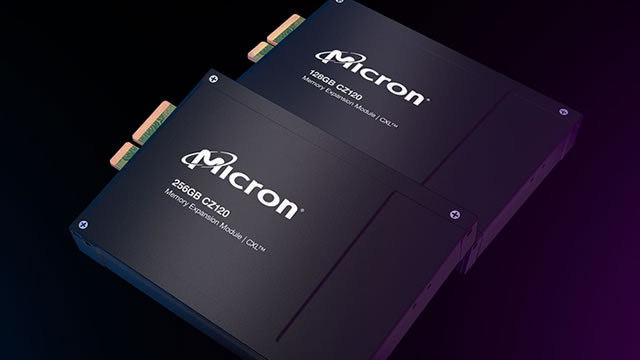 Is Micron Stock a Buy Right Now?
 DRAM ETF: Why It’s Falling, and Outflows Are Rising Despite Strong Micron, SanDisk and Samsung Earnings
 Micron: Market Mistook A Slowdown For A Total Collapse
Your note
Sign in to keep a note on MU — it syncs with the Stock Master app.
Insider holders
| Insider | Relation | Latest transaction | Date | Shares held |
|---|---|---|---|---|
| ALLEN SCOTT R | Officer | Sale | Jul 22, 2026 | 34,958 |
| ARNZEN APRIL S | Officer | Sale | Jun 30, 2026 | 85,737 |
| BEYER RICHARD M | Director | Stock Award(Grant) | Oct 12, 2025 | 97,408 |
| BHATIA MANISH H | Officer | Sale | Jan 21, 2026 | 323,486 |
| CORDANO MICHAEL D | Officer | Sale | Apr 13, 2026 | 44,059 |
| DEBOER SCOTT J. | President | Sale | Oct 15, 2026 | 147,430 |
Institution ownership
| Holder | % held | Shares | Value | Reported |
|---|---|---|---|---|
| Blackrock Inc. | 9.27% | 104,827,219 | 76.85B | Jun 29, 2026 |
| Vanguard Capital Management LLC | 6.51% | 73,659,544 | 54.00B | Jun 29, 2026 |
| State Street Corporation | 4.43% | 50,075,870 | 36.71B | Jun 29, 2026 |
| Invesco Ltd. | 3.21% | 36,315,240 | 26.62B | Jun 29, 2026 |
| Capital World Investors | 2.60% | 29,469,646 | 21.61B | Jun 29, 2026 |
| Geode Capital Management, LLC | 2.50% | 28,246,108 | 20.71B | Sep 29, 2026 |
Fund ownership
| Holder | % held | Shares | Value | Reported |
|---|---|---|---|---|
| VANGUARD INDEX FUNDS-Vanguard Total Stock Market Index Fund | 3.16% | 35,801,616 | 26.25B | Jun 29, 2026 |
| VANGUARD INDEX FUNDS-Vanguard 500 Index Fund | 2.58% | 29,226,007 | 21.43B | Jun 29, 2026 |
| Invesco QQQ Trust, Series 1 | 2.09% | 23,590,175 | 17.30B | Sep 29, 2026 |
| iShares Trust-iShares Core S&P 500 ETF | 1.33% | 15,049,335 | 11.03B | Sep 29, 2026 |
| Fidelity Concord Street Trust-Fidelity 500 Index Fund | 1.30% | 14,677,555 | 10.76B | Sep 29, 2026 |
| SPDR S&P 500 ETF TRUST-State Street SPDR S&P 500 ETF Trust | 1.24% | 13,973,547 | 10.24B | Sep 29, 2026 |