

Murata Manufacturing Co., Ltd. MRAAF
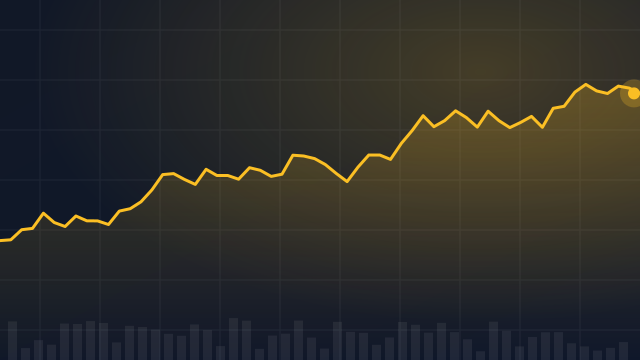
29.11 USD -9.21 (-24.03%)
At closeNov 5, 2026, 4:00 PM EST
29.33 Day range 30.57
17.15 52-week range 79.27
- YTD
- +29.38%
- 1 year
- +43.54%
- Market cap
- 52.69B
- EPS (ttm)
- 1.01
- P/E ratio
- 28.82
- YTD return
- +29.38%
- 1-year return
- +43.54%
- Volume
- 579
- Avg volume
- 12.27K
- Open
- 30.57
- Previous close
- 38.32
- Day's range
- 29.33 – 30.57
- 52-week range
- 17.15 – 79.27
- Earnings date
- Oct 30, 2026
YTD +7.93 (+37.06%)
Next earnings
Oct 30, 2026
Expected Oct 30, 2026. Consensus EPS estimate 0.3442.
Earnings
| Report date | Quarter ending | EPS estimate | EPS reported | Surprise | Surprise % |
|---|---|---|---|---|---|
| Oct 30, 2026 | Sep 30, 2026 | 0.3442 | — | — | — |
| Jul 31, 2026 | Jun 30, 2026 | 0.2487 | 0.2749 | +0.03 | +10.53% |
| Apr 30, 2026 | Mar 31, 2026 | 0.2122 | 0.2644 | +0.05 | +24.60% |
| Feb 2, 2026 | Dec 31, 2025 | 0.2306 | 0.08876 | -0.14 | -61.51% |
| Oct 31, 2025 | Sep 30, 2025 | 0.2214 | 0.3038 | +0.08 | +37.22% |
| Jul 30, 2025 | Jun 30, 2025 | 0.1806 | 0.1862 | +0.01 | +3.10% |
News
 Ariel International Fund Q3 2026 Highlights: Trades And Trends
 Impax International Sustainable Economy Fund Q2 2026 Contributors And Detractors
 Murata Collaborates with Synopsys to Provide Simulation Models Through Ansys Electromagnetic and Thermal Analysis Tools
 Ciena, Docusign And 3 Stocks To Watch Heading Into Thursday
 Stocks That Hit 52-Week Highs On Tuesday
 Stocks That Hit 52-Week Highs On Monday
 Stocks That Hit 52-Week Highs On Tuesday
Your note
Sign in to keep a note on MRAAF — it syncs with the Stock Master app.