

MINISO Group Holding Limited MNSO
At closeNov 4, 2026, 4:01 PM EST
After hours · Nov 4, 4:01 PM ET
- YTD
- -44.43%
- 1 year
- -50.62%
- Market cap
- 3.04B
- Revenue (ttm)
- 23.55B
- Profit margin
- 5.35%
- EPS (ttm)
- 0.59
- Shares out
- 291.85M
- P/E ratio
- 17.66
- Forward P/E
- 7.05
- Dividend
- 0.38 (3.69%)
- Ex-dividend date
- Apr 19, 2026
- YTD return
- -44.43%
- 1-year return
- -50.62%
- Volume
- 1.29M
- Avg volume
- 1.07M
- Open
- 10.52
- Previous close
- 10.21
- Day's range
- 10.16 – 10.48
- 52-week range
- 8.55 – 22.33
- Beta
- 0.13
- Analysts
- Buy
- Price target
- 14.20 (+36.3%)
2Y -8.57 (-45.18%)
Key statistics
- Enterprise value
- 9.00B
- PEG ratio
- 0.00
- Price / sales
- 0.13
- Price / book
- 2.02
- Dividend yield
- 3.69%
- Payout ratio
- 115.28%
- Revenue growth
- 17.00%
- Free cash flow
- 2.29B
- Total cash
- 7.39B
- Total debt
- 13.22B
- Return on equity
- 11.82%
- Short % of float
- 2.49%
- 50-day average
- 9.59
- 200-day average
- 13.56
Analyst view
Consensus: buy
- Target (low)
- 10.89
- Target (mean)
- 14.20
- Target (high)
- 19.51
- Strong buy2
- Buy11
- Hold4
- Sell0
- Strong sell0
Next earnings
Consensus EPS estimate 2.14.
Financials — quick view
Earnings
| Report date | Quarter ending | EPS estimate | EPS reported | Surprise | Surprise % |
|---|---|---|---|---|---|
| Aug 28, 2026 | Jun 30, 2026 | 0.31 | 0.14129 | -0.17 | -54.42% |
| May 26, 2026 | Mar 31, 2026 | 0.238 | 0.591 | +0.35 | +148.32% |
| Mar 31, 2026 | Dec 31, 2025 | 0.2713 | -0.06862 | -0.34 | -125.29% |
| Nov 20, 2025 | Sep 30, 2025 | 0.3418 | 0.2022 | -0.14 | -40.84% |
| Aug 21, 2025 | Jun 30, 2025 | 0.3292 | 0.2233 | -0.11 | -32.17% |
| May 23, 2025 | Mar 31, 2025 | 0.2765 | 0.1874 | -0.09 | -32.22% |
Upgrades / downgrades
| Date | Firm | Action | From | To |
|---|---|---|---|---|
| Aug 31, 2026 | HSBC | down | Buy | Hold |
| May 29, 2026 | JP Morgan | main | Overweight | Overweight |
| Aug 22, 2025 | Jefferies | up | Hold | Buy |
| Mar 25, 2025 | JP Morgan | up | Neutral | Overweight |
| Oct 4, 2024 | Citigroup | init | — | Buy |
| Sep 24, 2024 | JP Morgan | down | Overweight | Neutral |
About MINISO Group Holding Limited
MINISO Group Holding Limited, an investment holding company, engages in the retail and wholesale of design-led lifestyle and pop toy products in Mainland China, the rest of Asia, North and Latin America, Europe, and internationally. The company offers products in various categories, including home decor products, small electronics, textiles, accessories, beauty tools, toys, cosmetics, personal care products, snacks, fragrances and perfumes, and stationeries and gifts under the MINISO brand; and blind boxes, toy bricks, model figures, model kits, collectible dolls, Ichiban Kuji, and other popular toys under the TOP TOY brand. It also engages in brand licensing activity; and online sale of lifestyle products. MINISO Group Holding Limited was founded in 2013 and is based in Guangzhou, China.
- Sector
- Consumer Cyclical
- Industry
- Specialty Retail
- Country
- China
- Website
- miniso.com
News
 MINISO Group to Report September Quarter 2026 Financial Results on November 17, 2026
 MINISO Group Holding Limited Unsponsored ADR (MNSO) Ascends While Market Falls: Some Facts to Note
 MINISO Group Holding Limited Unsponsored ADR (MNSO) Is a Trending Stock: Facts to Know Before Betting on It
 MINISO Group Holding Limited Unsponsored ADR (MNSO) Stock Slides as Market Rises: Facts to Know Before You Trade
 MINISO Group Holding Limited Unsponsored ADR (MNSO) Stock Falls Amid Market Uptick: What Investors Need to Know
 Is It Worth Investing in MINISO Group Holding Limited (MNSO) Based on Wall Street's Bullish Views?
 Investors Heavily Search MINISO Group Holding Limited Unsponsored ADR (MNSO): Here is What You Need to Know
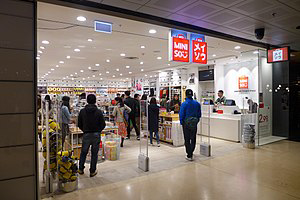 Is MINISO Group Holding Ltd (MNSO) a Bargain After 3.7% Drop? GF Value Says Undervalued
 12 Consumer Discretionary Stocks Moving In Wednesday's Pre-Market Session
 MINISO Group Holding Limited Unsponsored ADR (MNSO) Ascends While Market Falls: Some Facts to Note
Your note
Sign in to keep a note on MNSO — it syncs with the Stock Master app.
Institution ownership
| Holder | % held | Shares | Value | Reported |
|---|---|---|---|---|
| Serenity Capital Management Pte. Ltd | 0.71% | 2,141,535 | 22.27M | Jun 29, 2026 |
| Marshall Wace LLP | 0.52% | 1,570,379 | 16.33M | Jun 29, 2026 |
| Point72 Asset Management, L.P. | 0.37% | 1,109,518 | 11.54M | Jun 29, 2026 |
| UBS Group AG | 0.35% | 1,063,966 | 11.07M | Jun 29, 2026 |
| Millennium Management Llc | 0.32% | 965,407 | 10.04M | Jun 29, 2026 |
| State Street Corporation | 0.26% | 792,124 | 8.24M | Jun 29, 2026 |
Fund ownership
| Holder | % held | Shares | Value | Reported |
|---|---|---|---|---|
| Fidelity Investment Trust-Fidelity Pacific Basin Fund | 0.32% | 978,000 | 10.17M | Aug 30, 2026 |
| SPDR INDEX SHARES Fd.S-State Street SPDR PORT. Emerging Markets ETF | 0.05% | 137,056 | 1.43M | Sep 29, 2026 |
| American Century ETF Trust-Avantis Emerging Markets Equity ETF | 0.04% | 117,342 | 1.22M | Sep 29, 2026 |
| Invesco Exchange-Traded Fund Trust-Invesco Golden Dragon China ETF | 0.01% | 17,505 | 182.05K | Aug 30, 2026 |
| ETF Series Solutions-AAM Transformers ETF | 0.01% | 41,267 | 429.18K | Jul 30, 2026 |
| SPDR INDEX SHARES FUNDS-State Street SPDR S&P China ETF | 0.01% | 17,668 | 183.75K | Sep 29, 2026 |