

BlackRock Massachusetts Tax-Exempt Trust MHE
— —
Day range unavailable
52-week range unavailable
- Market cap
- 32.34M
No chart data for this range yet.
Key statistics
- Price / sales
- 0.00
- Dividend yield
- 0.00%
- Payout ratio
- 0.00%
- Revenue growth
- 0.00%
- Free cash flow
- 0
- Total cash
- 0
- Total debt
- 0
- Return on equity
- 0.00%
- 50-day average
- 13.58
- 200-day average
- 13.63
Next earnings
Consensus EPS estimate 0.00.
News
 BlackRock Announces Closing of Reorganizations of Six Municipal Closed-End Funds
 BlackRock Announces Results of Shareholder Vote at Adjourned Joint Special Shareholder Meeting Relating to the Reorganizations of Six Municipal Closed-End Funds
 BlackRock Announces Results of Shareholder Vote at Adjourned Joint Special Shareholder Meeting Relating to the Reorganizations of Six Municipal Closed-End Funds
 BlackRock Announces Results of Joint Special Shareholder Meeting Relating to the Reorganizations of Six Municipal Closed-End Funds
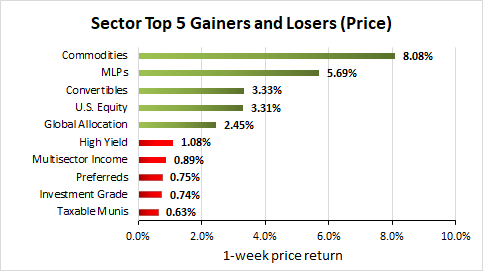 Weekly Closed-End Fund Roundup: August 9, 2020
 Arbitrage Opportunities In BlackRock Muni Closed-End Fund Reorganizations
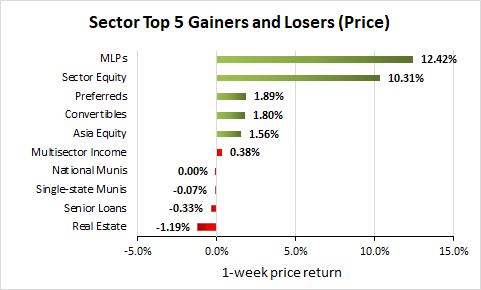 Weekly Closed-End Fund Roundup: June 21, 2020
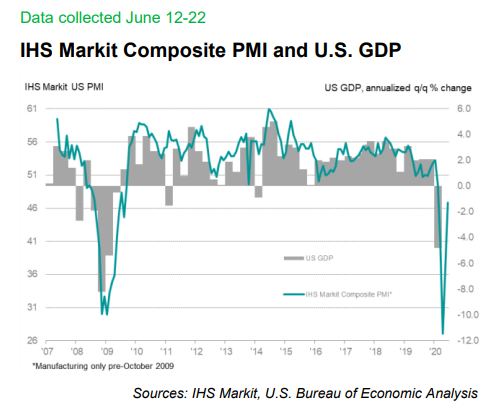 The Reopening Killed The V-Shaped Recovery
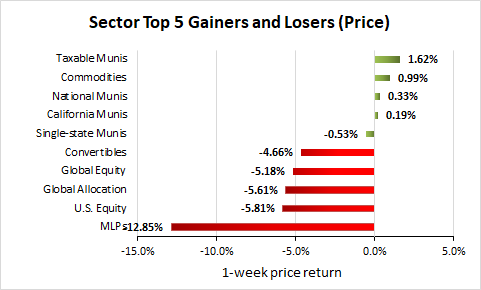 Weekly Closed-End Fund Roundup: June 14, 2020
 BlackRock MuniEnhanced Fund : Announces Board Approval of Municipal Closed-End Fund Reorganizations | MarketScreener
Your note
Sign in to keep a note on MHE — it syncs with the Stock Master app.
Insider holders
| Insider | Relation | Latest transaction | Date | Shares held |
|---|---|---|---|---|
| FETTER THOMAS J | President | Sale | Mar 18, 2004 | 0 |
| MACINTOSH ROBERT B | Officer | Sale | Mar 30, 2004 | 0 |
| MURPHY EDWARD MICHAEL | Director | Sale | Jan 15, 2003 | 0 |
| WOODBURY ERIC G | Officer | Sale | Mar 19, 1998 | 0 |
Institution ownership
| Holder | % held | Shares | Value | Reported |
|---|---|---|---|---|
| Bank of America Corporation | 2.01% | 47,770 | 642.03K | Dec 30, 2020 |
| Morgan Stanley | 1.93% | 45,803 | 615.59K | Dec 30, 2020 |
| Kestra Advisory Services, LLC | 1.02% | 24,294 | 326.51K | Dec 30, 2020 |
| Janney Montgomery Scott LLC | 0.57% | 13,400 | 180.10K | Dec 30, 2020 |
| Rockland Trust Company | 0.54% | 12,784 | 171.82K | Dec 30, 2020 |
| Commonwealth Equity Services, LLC | 0.48% | 11,348 | 152.52K | Dec 30, 2020 |