

PIMCO RAFI Dynamic Multi-Factor U.S. Equity ETF MFUS
66.26 USD +0.58 (+0.88%)
At closeNov 4, 2026, 4:00 PM EST
66.26 0.00 0.00%
After hours · Nov 4, 4:00 PM ET
65.89 Day range 66.26
54.14 52-week range 67.74
- YTD
- +17.05%
- 1 year
- +20.15%
- Market cap
- 303.46M
- EPS (ttm)
- 3.29
- P/E ratio
- 20.14
- YTD return
- +17.05%
- 1-year return
- +20.15%
- Volume
- 8.03K
- Avg volume
- 13.82K
- Open
- 66.27
- Previous close
- 65.68
- Day's range
- 65.89 – 66.26
- 52-week range
- 54.14 – 67.74
1D 0.00 (0.00%)
Key statistics
- Enterprise value
- 0
- PEG ratio
- 0.00
- Price / sales
- 0.00
- Price / book
- 0.00
- Dividend yield
- 0.00%
- Payout ratio
- 0.00%
- Short % of float
- 0.00%
- 50-day average
- 51.22
- 200-day average
- 48.35
About PIMCO RAFI Dynamic Multi-Factor U.S. Equity ETF
The fund seeks to achieve its investment objective by investing at least 80% of its total assets (exclusive of collateral held from securities lending) in the component securities of the RAFI Dynamic Multi-Factor U.S. Index. The underlying index is constructed by RAFI Indices, LLC (the "index provider") using a rules-based approach to construct factor portfolios within the underlying index. The underlying index consists of "factor portfolios," each of which emphasizes one of the following factors: value, low volatility, quality, momentum and size.
News
 VettaFi Discusses Multifactor ETFs on Bloomberg
 The MFUS Fundamental Multi-Factor ETF Is Ideal in Today's Market
 Short Interest in PIMCO RAFI Dynamic Multi-Factor U.S. Equity ETF (NYSEARCA:MFUS) Increases By 92.0%
 PIMCO RAFI Dynamic Multi-Factor U.S. Equity ETF $MFUS is Austin Wealth Management LLC’s 4th Largest Position
 PIMCO RAFI Dynamic Multi-Factor U.S. Equity ETF (NYSEARCA:MFUS) Short Interest Up 42.7% in January
 PIMCO RAFI Dynamic Multi-Factor U.S. Equity ETF $MFUS Shares Acquired by Cetera Investment Advisers
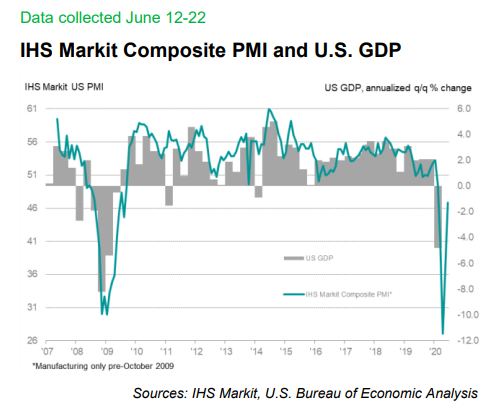 The Reopening Killed The V-Shaped Recovery
 PIMCO Bolsters ETF Lineup With Smart Beta Funds
Your note
Sign in to keep a note on MFUS — it syncs with the Stock Master app.