

LightWave Acquisition Corp. LWAC
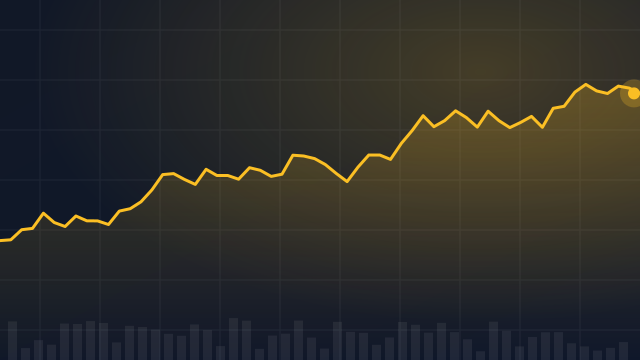
10.39 USD +0.02 (+0.19%)
At closeNov 3, 2026, 4:00 PM EST
9.99 -0.40 -3.84%
After hours · Nov 3, 4:00 PM ET
10.37 Day range 10.39
10.02 52-week range 10.40
- YTD
- +3.59%
- 1 year
- +3.28%
- Market cap
- 312.48M
- Shares out
- 18.05M
- YTD return
- +3.59%
- 1-year return
- +3.28%
- Volume
- 20.11K
- Avg volume
- 31.77K
- Open
- 10.37
- Previous close
- 10.37
- Day's range
- 10.37 – 10.39
- 52-week range
- 10.02 – 10.40
6M +0.19 (+1.87%)
Key statistics
- Enterprise value
- 381.80M
- PEG ratio
- 0.00
- Price / sales
- 0.00
- Price / book
- 76.49
- Dividend yield
- 0.00%
- Payout ratio
- 0.00%
- Revenue growth
- 0.00%
- Free cash flow
- 0
- Total cash
- 1.20M
- Total debt
- 0
- Return on equity
- 0.00%
- Short % of float
- 0.17%
- 50-day average
- 10.08
- 200-day average
- 9.89
Next earnings
Consensus EPS estimate 0.00.
Financials — quick view
LWAC Revenue — quarterly 0
LWAC Net income — quarterly 1.63M
LWAC EPS — quarterly 0.05
About LightWave Acquisition Corp.
Locust Walk Acquisition Corp. does not have significant operations. It intends to effect a merger, capital stock exchange, asset acquisition, stock purchase, reorganization, or similar business combination with one or more businesses. The company was incorporated in 2020 and is based in Boston, Massachusetts.
- Sector
- Financial Services
- Industry
- Shell Companies
- Country
- United States
- Website
- locustwalkacquisitioncorp.com
News
 LightWave Acquisition Corp. Announces Closing of $215,625,000 Initial Public Offering, Including Full Exercise of Underwriters' Over-Allotment Option
 LightWave Acquisition Corp. Announces Pricing of $187,500,000 Initial Public Offering
 54 Biggest Movers From Yesterday
 LWAC Stock: eFFECTOR Therapeutics SPAC Merger News Sends Shares Skyrocketing
 36 Stocks Moving In Wednesday's Mid-Day Session
 Stocks That Hit 52-Week Highs On Wednesday
 Moore Kuehn Encourages FMBI, LWAC, LEGO and FORE Investors to Contact Law Firm
Your note
Sign in to keep a note on LWAC — it syncs with the Stock Master app.
Institution ownership
| Holder | % held | Shares | Value | Reported |
|---|---|---|---|---|
| Empyrean Capital Partners, LP | 5.54% | 1,000,000 | 9.89M | Jun 29, 2021 |
| Linden Advisors LP | 5.04% | 909,189 | 8.99M | Jun 29, 2021 |
| Aristeia Capital, LLC | 4.79% | 863,587 | 8.54M | Jun 29, 2021 |
| MMCAP International, Inc. SPC | 3.47% | 625,450 | 6.19M | Jun 29, 2021 |
| Citadel Advisors LLC | 3.35% | 603,805 | 5.97M | Jun 29, 2021 |
| Polar Asset Management Partners Inc. | 2.77% | 499,998 | 4.94M | Jun 29, 2021 |
Fund ownership
| Holder | % held | Shares | Value | Reported |
|---|---|---|---|---|
| Highland Fds I-NexPoint Merger Arbitrage Fund | 0.08% | 14,599 | 142.32K | Mar 30, 2021 |
| Fidelity NASDAQ Composite Index Fund | 0.04% | 7,356 | 72.75K | Jun 29, 2021 |
| RiverNorth Opportunities Fd | 0.04% | 7,029 | 68.88K | Apr 29, 2021 |
| Weiss Strategic Interval Fd | 0.02% | 4,390 | 43.42K | Jun 29, 2021 |
| SEI Institutional Managed Tr-Multi Strategy Alternative Fund | 0.01% | 1,669 | 16.27K | Mar 30, 2021 |