

NYLIM Candriam U.S. Mid Cap Equity ETF IQSM
38.51 USD -1.13 (-2.86%)
At closeNov 5, 2026, 4:10 PM EST
38.51 0.00 0.00%
After hours · Nov 5, 4:10 PM ET
38.41 Day range 39.56
32.77 52-week range 40.88
- YTD
- +11.23%
- 1 year
- +13.42%
- Market cap
- 364.72M
- EPS (ttm)
- 2.00
- P/E ratio
- 19.26
- YTD return
- +11.23%
- 1-year return
- +13.42%
- Volume
- 16.04K
- Avg volume
- 40.81K
- Open
- 39.56
- Previous close
- 39.64
- Day's range
- 38.41 – 39.56
- 52-week range
- 32.77 – 40.88
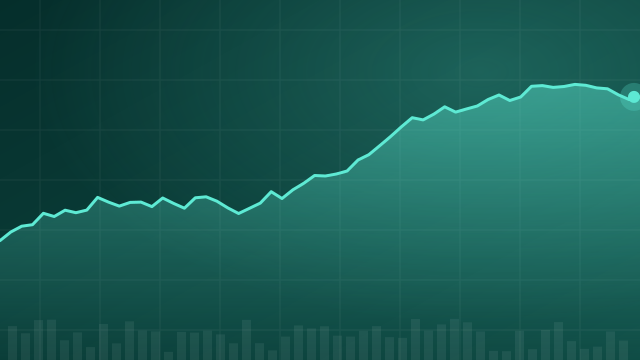
2Y +5.31 (+15.96%)
Key statistics
- Enterprise value
- 0
- PEG ratio
- 0.00
- Price / sales
- 0.00
- Price / book
- 0.00
- Dividend yield
- 0.00%
- Payout ratio
- 0.00%
- Short % of float
- 0.00%
- 50-day average
- 33.85
- 200-day average
- 31.85
About NYLIM Candriam U.S. Mid Cap Equity ETF
The underlying index is designed to deliver exposure to equity securities of companies meeting environmental, social and corporate governance (ESG) criteria developed by Candriam and weighted using a market-capitalization weighting methodology. Under normal circumstances, at least 80% of the value of its assets in U.S. equity securities of mid-capitalization companies.
News




Your note
Sign in to keep a note on IQSM — it syncs with the Stock Master app.