

Alpha Architect International Quantitative Momentum ETF IMOM
36.40 USD +0.33 (+0.92%)
At closeNov 11, 2026, 4:00 PM EST
36.36 -0.04 -0.10%
After hours · Nov 11, 4:00 PM ET
36.15 Day range 36.44
34.62 52-week range 46.17
- YTD
- -4.52%
- 1 year
- -3.33%
- Market cap
- 137.96M
- EPS (ttm)
- 2.18
- P/E ratio
- 16.70
- YTD return
- -4.52%
- 1-year return
- -3.33%
- Volume
- 2.76K
- Avg volume
- 15.94K
- Open
- 36.15
- Previous close
- 36.07
- Day's range
- 36.15 – 36.44
- 52-week range
- 34.62 – 46.17
5D -0.67 (-1.83%)
Key statistics
- Enterprise value
- 0
- PEG ratio
- 0.00
- Price / sales
- 0.00
- Price / book
- 0.00
- Dividend yield
- 0.00%
- Payout ratio
- 0.00%
- Short % of float
- 0.00%
- 50-day average
- 28.11
- 200-day average
- 28.12
About Alpha Architect International Quantitative Momentum ETF
The Sub-Adviser employs a multi-step, quantitative, rules-based methodology to identify a portfolio of approximately 50 to 200 non-U.S. equity securities with the highest relative momentum. A “momentum” style of investing emphasizes investing in securities that have had higher recent total return performance compared to other securities. The Sub-Adviser then employs proprietary screens to eliminate companies with issues that may negatively impact their momentum.
News
 Tower Semiconductor Climbs on Silicon Photonics Expansion Deal
 IMOM: Better Tactical ETF Than Long-Term Holding
 ETF Odds & Ends: 2022 Leads 2021 For Launches
 Alpha Architect Switches ETFs to Active Management
 ETF Odds & Ends: Muted Launches, More Closures
 Week 13 MDA Breakout Stocks - April 2021: Short-Term Picks To Give You An Edge
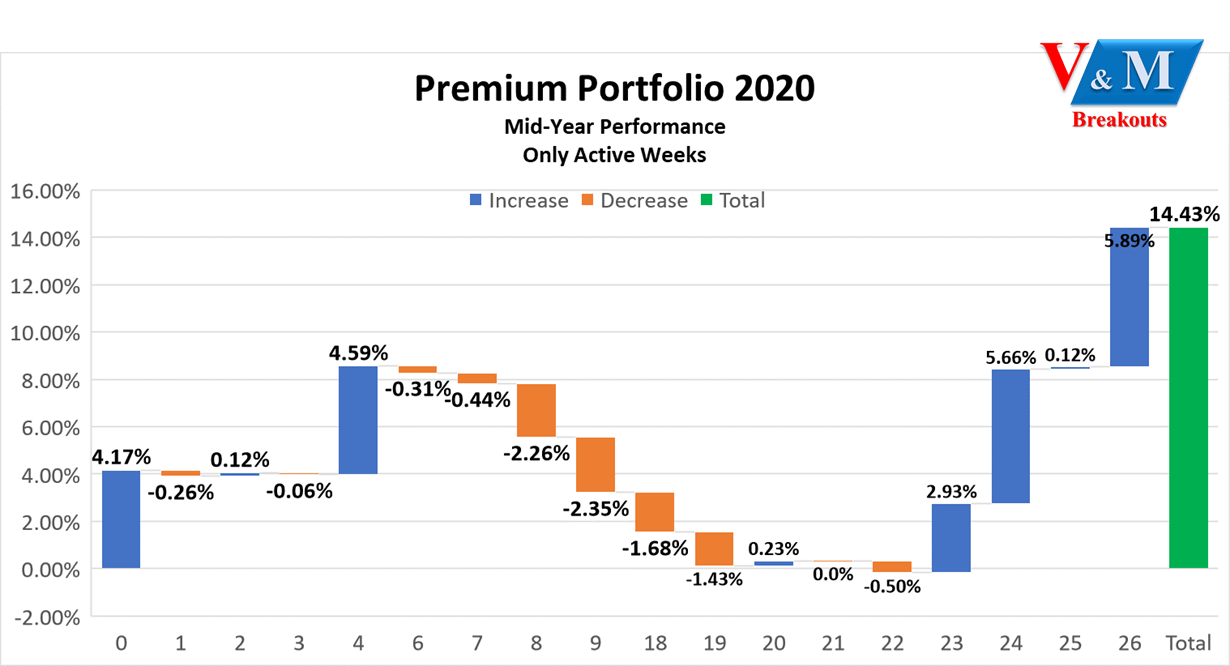 V&M Premium Portfolio: 2020 Mid-Year Report Card Through Week 26
 5 International ETFs Beating S&P 500 in 2020
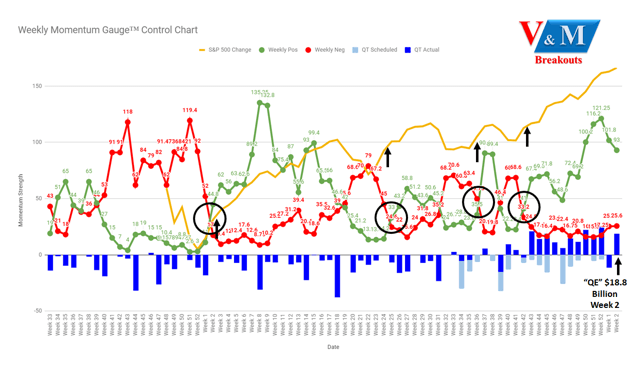 Week 3 MDA Breakout Forecast: Short-Term Picks To Give You An Edge
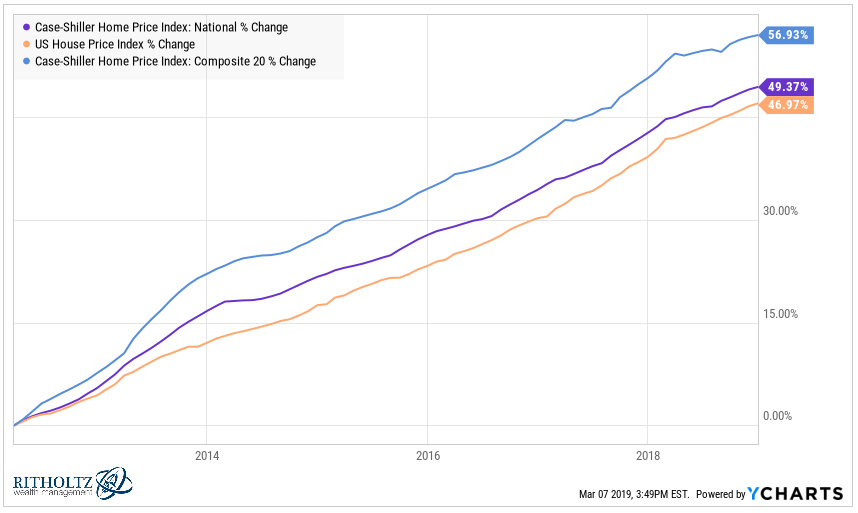 The Real Estate Market in Charts - A Wealth of Common Sense
Your note
Sign in to keep a note on IMOM — it syncs with the Stock Master app.