

Hewlett Packard Enterprise Company HPE
Regular-session close
After hours · Nov 13, 7:58 PM ET
- YTD
- +101.04%
- 1 year
- +110.60%
- Market cap
- 64.10B
- Revenue (ttm)
- 41.87B
- Profit margin
- 6.67%
- EPS (ttm)
- 1.94
- Shares out
- 1.33B
- P/E ratio
- 24.89
- Forward P/E
- 10.20
- Dividend
- 0.57 (1.14%)
- Ex-dividend date
- Sep 17, 2026
- YTD return
- +101.04%
- 1-year return
- +110.60%
- Volume
- 10.73M
- Avg volume
- 20.35M
- Open
- 49.85
- Previous close
- 50.16
- Day's range
- 46.96 – 50.29
- 52-week range
- 20.00 – 73.46
- Beta
- 1.47
- Analysts
- Buy
- Price target
- 72.20 (+49.5%)
- Earnings date
- Nov 23, 2026
5D +2.58 (+5.64%)
Key statistics
- Enterprise value
- 80.75B
- PEG ratio
- 0.40
- Price / sales
- 1.53
- Price / book
- 2.42
- Dividend yield
- 1.14%
- Payout ratio
- 28.74%
- Revenue growth
- 33.70%
- Free cash flow
- 4.74B
- Total cash
- 6.22B
- Total debt
- 20.32B
- Return on equity
- 10.94%
- Short % of float
- 3.98%
- 50-day average
- 58.97
- 200-day average
- 42.01
Analyst view
Consensus: buy
- Target (low)
- 62.00
- Target (mean)
- 72.20
- Target (high)
- 92.00
- Strong buy5
- Buy10
- Hold9
- Sell0
- Strong sell0
Next earnings
Nov 23, 2026
Expected Nov 23, 2026. Consensus EPS estimate 1.28.
Financials — quick view
Earnings
| Report date | Quarter ending | EPS estimate | EPS reported | Surprise | Surprise % |
|---|---|---|---|---|---|
| Nov 23, 2026 | Oct 31, 2026 | 1.27 | — | — | — |
| Sep 2, 2026 | Jul 31, 2026 | 0.932 | 1.11 | +0.18 | +19.10% |
| Jun 1, 2026 | Apr 30, 2026 | 0.535 | 0.79 | +0.26 | +47.66% |
| Mar 9, 2026 | Jan 31, 2026 | 0.587 | 0.65 | +0.06 | +10.73% |
| Dec 4, 2025 | Oct 31, 2025 | 0.579 | 0.62 | +0.04 | +7.08% |
| Sep 3, 2025 | Jul 31, 2025 | 0.417 | 0.44 | +0.02 | +5.52% |
Upgrades / downgrades
| Date | Firm | Action | From | To |
|---|---|---|---|---|
| Oct 14, 2026 | Barclays | down | Overweight | Equal-Weight |
| Oct 2, 2026 | Daiwa Capital | up | Neutral | Outperform |
| Oct 1, 2026 | Citigroup | main | Buy | Buy |
| Oct 1, 2026 | Morgan Stanley | main | Overweight | Overweight |
| Oct 1, 2026 | Evercore ISI Group | main | In-Line | In-Line |
| Oct 1, 2026 | UBS | main | Neutral | Neutral |
About Hewlett Packard Enterprise Company
Hewlett Packard Enterprise Company, together with its subsidiaries, develops intelligent solutions in the United States, the Americas, Europe, the Middle East, Africa, the Asia Pacific, Japan, and internationally. It operates in five segments: Server, Hybrid Cloud, Networking, Financial Services, and Corporate Investments and Other. The company offers general-purpose servers, workload-optimized servers, and integrated systems, including HPE ProLiant Rack and Tower servers; HPE Synergy; HPE Scale Up servers; HPE Edgeline servers; HPE Cray EX; HPE Cray XD; and HPE NonStop. It also provides cloud-native and hybrid solutions, such as HPE Alletra Storage; HPE InfoSight; HPE CloudPhysics; and HPE GreenLake. In addition, the company develops and sells networking and security products and services comprising hardware products, which include Wi-Fi and private cellular access points, MX and PTX routers, and gateways, as well as QFX, EX, and CX switches; software products, such as Mist and Aruba Central; and services comprising professional, maintenance, support services, management software, and education and training programs. Further, it offers investment solutions, including leasing, financing, IT consumption, utility programs, and asset management services, as well as supports financial solutions for on-premise flexible consumption models. The company serves commercial and large enterprise groups, as well as business and public sector enterprises. It sells its products through resellers, distribution partners, master area partners, original equipment manufacturers, independent software vendors, systems integrators, and advisory firms. The company was founded in 1939 and is headquartered in Spring, Texas.
- Sector
- Technology
- Industry
- Communication Equipment
- Country
- United States
- Website
- hpe.com
News
 DLLL 2X Dell ETF Plunges 16% as Dell Tumbles 8% in AI Hardware Selloff; Hewlett Packard Enterprise Falls 4%
 HPE vs. SMCI: Which AI Infrastructure Stock Has More Upside Now?
 IonQ Shares Drop on Sudden Leadership Shake-Up
 Cisco Slides 5% Despite Raising AI Outlook to $9 Billion as Citi Says Growth May Have Peaked; Hewlett Packard Enterprise Retreats 5%, Arista Falls 3%
 Super Micro Computer Cratered Again, Down 35% in One Month: This Lead Analyst Who Just Defended Nvidia Says Super Micro Computer Shares to Gain 140%
 The 10 best stocks for a year-end momentum trade
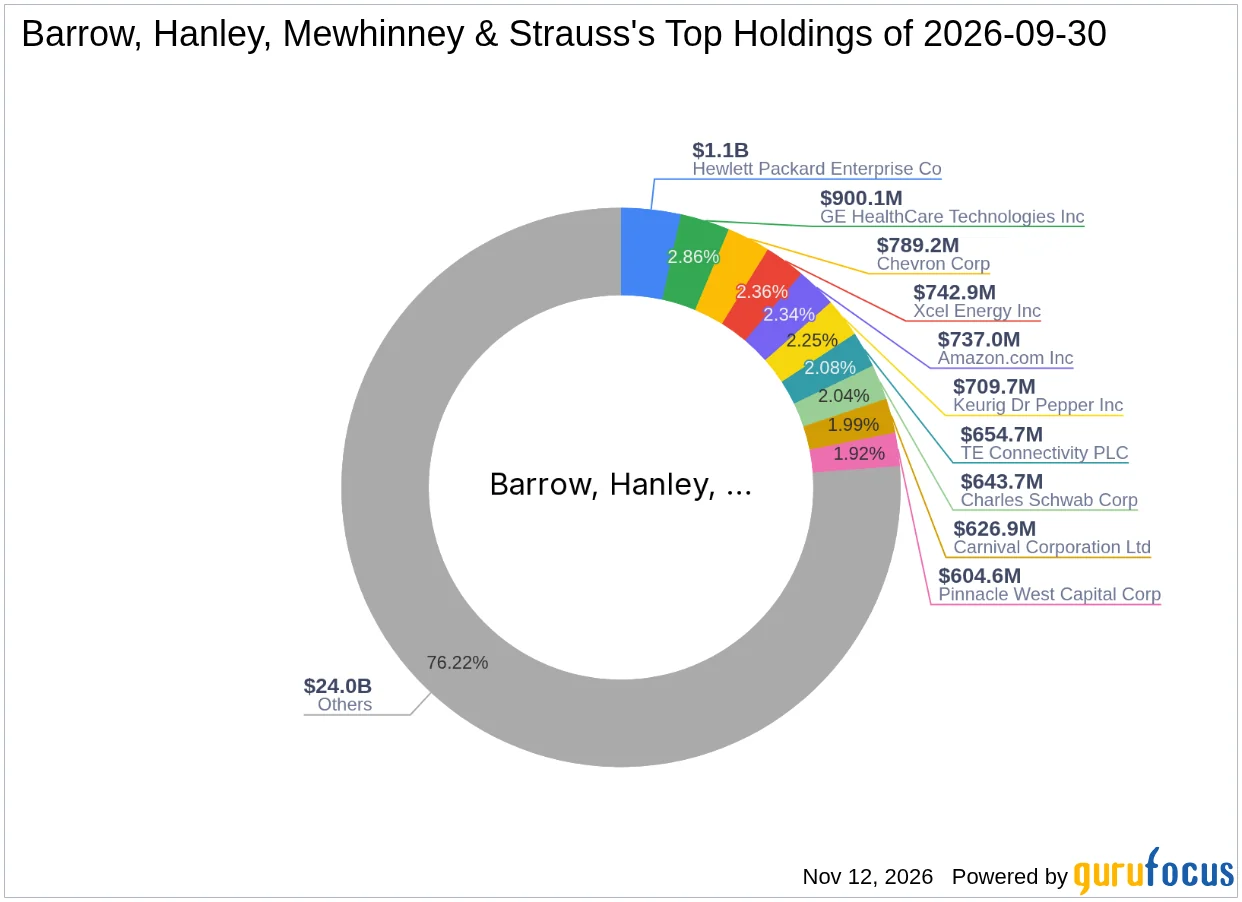 Barrow, Hanley, Mewhinney & Strauss's Top Q3 2026 Move: Amazon.com Inc at a 2.34% Portfolio Impact
 Super Micro Slides 7% Despite Gartner’s $957 Billion AI Server Forecast; Dell Falls 4%, Hewlett Packard Enterprise Dips
 Can HPE Sustain Growth Amid Evolving AI Market Dynamics?
 Prediction: One AI Trend Could Send Dell Stock Higher
Your note
Sign in to keep a note on HPE — it syncs with the Stock Master app.
Insider holders
| Insider | Relation | Latest transaction | Date | Shares held |
|---|---|---|---|---|
| CARTER PAMELA LYNN | Director | Conversion of Exercise of derivative security | Mar 31, 2026 | 173,172 |
| LANE RAYMOND J | Director | Stock Award(Grant) | Sep 29, 2026 | 990,793 |
| LIVERMORE ANN M | Director | Conversion of Exercise of derivative security | Mar 31, 2026 | 218,391 |
| MYERS MARIE ELIZABETH | Chief Financial Officer | Sale | May 4, 2026 | 204,754 |
| NERI ANTONIO F | Chief Executive Officer | Sale | Oct 4, 2026 | 0 |
| NOSKI CHARLES HOWARD | Director | Conversion of Exercise of derivative security | Mar 31, 2026 | 0 |
Institution ownership
| Holder | % held | Shares | Value | Reported |
|---|---|---|---|---|
| Blackrock Inc. | 10.10% | 134,059,655 | 6.48B | Jun 29, 2026 |
| Vanguard Capital Management LLC | 6.53% | 86,665,707 | 4.19B | Jun 29, 2026 |
| Vanguard Portfolio Management LLC | 5.47% | 72,677,094 | 3.51B | Jun 29, 2026 |
| State Street Corporation | 5.13% | 68,117,951 | 3.29B | Sep 29, 2026 |
| Capital World Investors | 4.05% | 53,828,641 | 2.60B | Sep 29, 2026 |
| JPMORGAN CHASE & CO | 3.79% | 50,350,752 | 2.43B | Sep 29, 2026 |
Fund ownership
| Holder | % held | Shares | Value | Reported |
|---|---|---|---|---|
| VANGUARD INDEX FUNDS-Vanguard Total Stock Market Index Fund | 3.17% | 42,124,488 | 2.03B | Jun 29, 2026 |
| VANGUARD INDEX FUNDS-Vanguard 500 Index Fund | 2.59% | 34,384,007 | 1.66B | Jun 29, 2026 |
| VANGUARD INDEX FUNDS-Vanguard Mid-Cap Index Fund | 2.17% | 28,749,604 | 1.39B | Jun 29, 2026 |
| iShares Trust-iShares Core S&P 500 ETF | 1.33% | 17,645,054 | 852.26M | Sep 29, 2026 |
| Fidelity Concord Street Trust-Fidelity 500 Index Fund | 1.30% | 17,209,305 | 831.21M | Sep 29, 2026 |
| SPDR S&P 500 ETF TRUST-State Street SPDR S&P 500 ETF Trust | 1.23% | 16,357,707 | 790.08M | Sep 29, 2026 |