
Halliburton Company HAL
Set alert
At close
Pre-market · Nov 2, 4:09 AM ET
- YTD
- +27.99%
- 1 year
- +34.76%
- Open
- 36.25
- Prev close
- 35.90
- Mkt cap
- 29.92B
- Vol
- 7.88M
- Avg vol
- 10.46M
- EPS
- 2.38
- P/E
- 15.20
- Div yield
- 1.89%
More statistics
- Low
- 35.76
- High
- 36.54
- Forward P/E
- 12.31
- Beta
- 0.84
- Short ratio
- 3.40
- Inst. own
- 90.77%
- Dividend
- 0.68
- Ex-div date
- Sep 1, 2026
- Earnings
- Jan 20, 2027
- 50-d avg
- 34.25
- 200-d avg
- 35.82
- 1y target
- 43.68
MAX chart
Events in this range
- Mar 2, 1987Dividend: 0.25
- Mar 4, 1996Dividend: 0.25
- Jun 3, 1996Dividend: 0.25
- Mar 3, 1997Dividend: 0.25
- Jun 2, 1997Dividend: 0.25
- Mar 2, 1998Dividend: 0.125
- Jun 1, 1998Dividend: 0.125
- Sep 1, 1998Dividend: 0.125
- Mar 2, 1999Dividend: 0.125
- Jun 1, 1999Dividend: 0.125
- Sep 1, 2000Dividend: 0.125
- Jun 4, 2001Dividend: 0.125
- Sep 4, 2001Dividend: 0.125
- Jun 4, 2002Dividend: 0.125
- Sep 3, 2002Dividend: 0.125
- Mar 4, 2003Dividend: 0.125
- Jun 3, 2003Dividend: 0.125
- Sep 2, 2003Dividend: 0.125
- Mar 2, 2004Dividend: 0.125
- Jun 1, 2004Dividend: 0.125
- Mar 1, 2005Dividend: 0.125
- Dec 1, 2008Dividend: 0.09
- Dec 1, 2009Dividend: 0.09
- Dec 1, 2010Dividend: 0.09
- Mar 5, 2012Dividend: 0.09
- Jun 4, 2012Dividend: 0.09
- Dec 4, 2012Dividend: 0.09
- Mar 4, 2013Dividend: 0.125
- Jun 3, 2013Dividend: 0.125
- Dec 4, 2013Dividend: 0.15
- Mar 3, 2014Dividend: 0.15
- Jun 2, 2014Dividend: 0.15
- Dec 3, 2014Dividend: 0.18
- Mar 2, 2015Dividend: 0.18
- Jun 1, 2015Dividend: 0.18
- Dec 1, 2015Dividend: 0.18
- Sep 2, 2016Dividend: 0.18
- Dec 5, 2016Dividend: 0.18
- Jun 5, 2017Dividend: 0.18
- Sep 1, 2017Dividend: 0.18
- Dec 6, 2017Dividend: 0.18
- Dec 7, 2017Dividend: 0.18
- Mar 6, 2018Dividend: 0.18
- Jun 5, 2018Dividend: 0.18
- Sep 4, 2018Dividend: 0.18
- Dec 5, 2018Dividend: 0.18
- Dec 6, 2018Dividend: 0.18
- Mar 5, 2019Dividend: 0.18
- Jun 4, 2019Dividend: 0.18
- Sep 3, 2019Dividend: 0.18
- Dec 4, 2019Dividend: 0.18
- Dec 5, 2019Dividend: 0.18
- Mar 3, 2020Dividend: 0.18
- Jun 2, 2020Dividend: 0.045
- Sep 1, 2020Dividend: 0.045
- Dec 2, 2020Dividend: 0.045
- Dec 3, 2020Dividend: 0.045
- Mar 2, 2021Dividend: 0.045
- Jun 1, 2021Dividend: 0.045
- Mar 1, 2022Dividend: 0.12
- Sep 6, 2022Dividend: 0.12
- Dec 7, 2022Dividend: 0.12
- Jun 6, 2023Dividend: 0.16
- Sep 5, 2023Dividend: 0.16
- Dec 6, 2023Dividend: 0.16
- Mar 5, 2024Dividend: 0.17
- Jun 5, 2024Dividend: 0.17
- Sep 4, 2024Dividend: 0.17
- Dec 4, 2024Dividend: 0.17
- Mar 5, 2025Dividend: 0.17
- Jun 4, 2025Dividend: 0.17
- Sep 3, 2025Dividend: 0.17
- Dec 3, 2025Dividend: 0.17
- Mar 4, 2026Dividend: 0.17
- Jun 3, 2026Dividend: 0.17
- Sep 2, 2026Dividend: 0.17
Signals (74)
| Name | Date | Ago |
|---|---|---|
| MACD: Buy Signal | Mar 1, 2026 | 8 months ago |
| SMA: Bullish | Dec 1, 2025 | 11 months ago |
| SMA: Bullish | Dec 1, 2025 | 11 months ago |
| MACD: Sell Signal | Mar 1, 2025 | 1 year ago |
| SMA: Bearish | Dec 1, 2024 | 1 year ago |
| SMA: Bearish | Jun 1, 2024 | 2 years ago |
| SMA: Bullish | Jun 1, 2023 | 3 years ago |
| SMA: Bullish | Jun 1, 2023 | 3 years ago |
| SMA: Bearish | Mar 1, 2023 | 3 years ago |
| SMA: Bearish | Mar 1, 2023 | 3 years ago |
| SMA: Bullish | Sep 1, 2022 | 4 years ago |
| SMA: Bearish | Jun 1, 2022 | 4 years ago |
| SMA: Bullish | Dec 1, 2021 | 4 years ago |
| MACD: Buy Signal | Dec 1, 2021 | 4 years ago |
| SMA: Bullish | Dec 1, 2020 | 5 years ago |
| SMA: Bearish | Jun 1, 2018 | 8 years ago |
| SMA: Bearish | Jun 1, 2018 | 8 years ago |
| SMA: Bullish | Dec 1, 2017 | 8 years ago |
| SMA: Bullish | Dec 1, 2017 | 8 years ago |
| SMA: Bearish | Jun 1, 2017 | 9 years ago |
| SMA: Bearish | Jun 1, 2017 | 9 years ago |
| SMA: Bullish | Sep 1, 2016 | 10 years ago |
| SMA: Bullish | Mar 1, 2016 | 10 years ago |
| SMA: Bearish | Dec 1, 2015 | 10 years ago |
| MACD: Sell Signal | Mar 1, 2015 | 11 years ago |
| SMA: Bearish | Sep 1, 2014 | 12 years ago |
| RSI: Overbought | Mar 1, 2014 | 12 years ago |
| MACD: Buy Signal | Jun 1, 2013 | 13 years ago |
| SMA: Bullish | Dec 1, 2012 | 13 years ago |
| SMA: Bullish | Dec 1, 2012 | 13 years ago |
| SMA: Bearish | Mar 1, 2012 | 14 years ago |
| SMA: Bearish | Mar 1, 2012 | 14 years ago |
| MACD: Sell Signal | Mar 1, 2012 | 14 years ago |
| MACD: Buy Signal | Dec 1, 2010 | 15 years ago |
| SMA: Bullish | Sep 1, 2010 | 16 years ago |
| SMA: Bullish | Jun 1, 2010 | 16 years ago |
| SMA: Bearish | Mar 1, 2010 | 16 years ago |
| SMA: Bullish | Sep 1, 2009 | 17 years ago |
| SMA: Bearish | Sep 1, 2008 | 18 years ago |
| SMA: Bearish | Sep 1, 2008 | 18 years ago |
| MACD: Sell Signal | Sep 1, 2008 | 18 years ago |
| RSI: Overbought | Mar 1, 2008 | 18 years ago |
| RSI: Overbought | Dec 1, 2005 | 20 years ago |
| SMA: Bullish | Sep 1, 2004 | 22 years ago |
| MACD: Buy Signal | Jun 1, 2004 | 22 years ago |
| SMA: Bullish | Jun 1, 2003 | 23 years ago |
| SMA: Bearish | Jun 1, 2001 | 25 years ago |
| SMA: Bearish | Jun 1, 2001 | 25 years ago |
| SMA: Bullish | Mar 1, 2001 | 25 years ago |
| SMA: Bearish | Sep 1, 2000 | 26 years ago |
| MACD: Sell Signal | Sep 1, 2000 | 26 years ago |
| SMA: Bullish | Mar 1, 2000 | 26 years ago |
| MACD: Buy Signal | Mar 1, 2000 | 26 years ago |
| SMA: Bearish | Sep 1, 1999 | 27 years ago |
| MACD: Sell Signal | Sep 1, 1999 | 27 years ago |
| MACD: Buy Signal | Jun 1, 1999 | 27 years ago |
| SMA: Bullish | Mar 1, 1999 | 27 years ago |
| MACD: Sell Signal | Dec 1, 1998 | 27 years ago |
| SMA: Bearish | Jun 1, 1998 | 28 years ago |
| RSI: Overbought | Dec 1, 1996 | 29 years ago |
| MACD: Buy Signal | Jun 1, 1995 | 31 years ago |
| SMA: Bullish | Dec 1, 1994 | 31 years ago |
| SMA: Bullish | Sep 1, 1994 | 32 years ago |
| SMA: Bearish | Sep 1, 1993 | 33 years ago |
| SMA: Bearish | Sep 1, 1993 | 33 years ago |
| SMA: Bullish | Mar 1, 1993 | 33 years ago |
| SMA: Bullish | Dec 1, 1992 | 33 years ago |
| SMA: Bearish | Sep 1, 1992 | 34 years ago |
| SMA: Bullish | Jun 1, 1992 | 34 years ago |
| SMA: Bearish | Jun 1, 1991 | 35 years ago |
| SMA: Bullish | Jun 1, 1989 | 37 years ago |
| SMA: Bearish | Jun 1, 1988 | 38 years ago |
| SMA: Bullish | Dec 1, 1987 | 38 years ago |
| SMA: Bearish | Sep 1, 1987 | 39 years ago |
News

3 days ago zacks.com
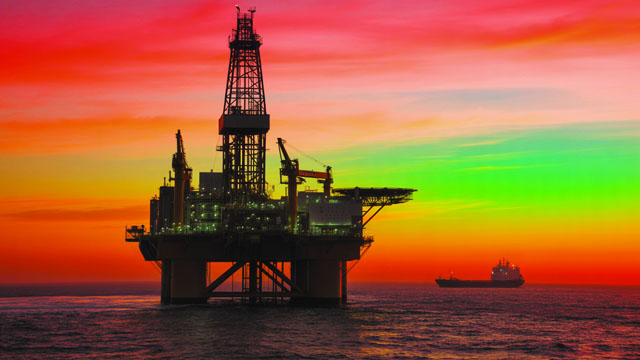
Halliburton Deploys ROCS Technology With Petrobras in Brazil
HAL deploys ROCS technology with PBR in Brazil, simplifying deepwater well completions by reducing equipment needs and offshore complexity.

4 days ago businesswire.com
Halliburton Deploys ROCS Technology With Petrobras in a Deepwater Completion Operation in Brazil
HOUSTON--(BUSINESS WIRE)--Optime, a Halliburton service, completed the first deployment of the Optime Remote Operated Control System (ROCS) service in Brazil, in collaboration with Petrobras. ROCS…
5 days ago zacks.com
Here's Why a Hold Strategy Is Apt for Halliburton Stock for Now
HAL's global expansion, offshore contracts and technology investments fuel growth, but North American weakness and declining EPS estimates raise concerns.

1 week ago benzinga.com
Oil Tops $100 on Iran Fears, Energy ETF XLE Hits New Record: Stock Market Today
WTI crude rose above $100 on fears of renewed U.S. strikes on Iran, lifting XLE to a record while staples, telecoms and the Dow slipped at midday Friday.
-
1 week ago benzinga.com
UBS Maintains Neutral on Halliburton, Lowers Price Target to $41
UBS analyst Josh Silverstein maintains Halliburton (NYSE:HAL) with a Neutral and lowers the price target from $42 to $41.
-
1 week ago benzinga.com
Jefferies Maintains Buy on Halliburton, Raises Price Target to $48
Jefferies analyst Lloyd Byrne maintains Halliburton (NYSE:HAL) with a Buy and raises the price target from $47 to $48.

1 week ago benzinga.com
Halliburton’s Light International Mix Could Be a Growth Headwind, Analyst Says
Halliburton beats Q3 EPS estimates. RBC's Keith Mackey keeps Outperform, lifts target, citing 2027 growth outlook despite margin

1 week ago benzinga.com
These Analysts Revise Their Forecasts On Halliburton Following Q3 Results
Halliburton beats Q3 estimates with $5.703B revenue and 60¢ EPS; RBC raises target to $46, while Barclays cuts its target to $51.
-
1 week ago benzinga.com
Barclays Maintains Overweight on Halliburton, Lowers Price Target to $51
Barclays analyst David Anderson maintains Halliburton (NYSE:HAL) with a Overweight and lowers the price target from $53 to $51.
-
1 week ago benzinga.com
RBC Capital Maintains Outperform on Halliburton, Raises Price Target to $46
RBC Capital analyst Keith Mackey maintains Halliburton (NYSE:HAL) with a Outperform and raises the price target from $45 to $46.

1 week ago benzinga.com
Halliburton CEO Sounds Alarm on Massive Oil Supply Shock
Halliburton (HAL) beats Q3 estimates with $5.7B revenue as strong international growth offsets weakness in North America. Read more.

1 week ago benzinga.com
Halliburton Q3 2026 Earnings Call Transcript
Halliburton (NYSE:HAL) reported third-quarter financial results on Tuesday. The transcript from the company’s third-quarter earnings call has been provided below.Benzinga APIs provide real-time…
-
1 week ago benzinga.com
Halliburton Q3 Adj. EPS $0.60 Beats $0.58 Estimate, Sales $5.703B Beat $5.572B Estimate
Halliburton (NYSE:HAL) reported quarterly earnings of $0.60 per share which beat the analyst consensus estimate of $0.58 by 3.45 percent. This is a 3.45 percent increase over earnings of $0.58 per…

1 week ago benzinga.com
SpaceX, GE Aerospace On Deck Tuesday As Growth, Aerospace Demand Face Test
Space Exploration Technologies headlines Tuesday’s reports, with investors focused on whether Starlink growth and launch activity can justify the company’s scale. GE Aerospace, RTX, 3M, General…

1 week ago benzinga.com
SpaceX Could Swing $128 Billion After Earnings
Discover 9 stocks with the biggest expected earnings moves for Q3 2026, including Netflix, United Airlines, Intuitive Surgical and SpaceX, based on options market data.
-
1 week ago benzinga.com
Piper Sandler Maintains Overweight on Halliburton, Lowers Price Target to $42
Piper Sandler analyst Derek Podhaizer maintains Halliburton (NYSE:HAL) with a Overweight and lowers the price target from $43 to $42.

2 weeks ago benzinga.com
Top Wall Street Forecasters Revamp Halliburton Expectations Ahead Of Q3 Earnings
Halliburton reports Q3 earnings Oct. 20; analysts expect 59¢ EPS and $5.58B revenue. Shares closed at $32.83 after Venezuela energy deals.

3 weeks ago benzinga.com
JPMorgan’s October Stock Picks Hint at 3 ETF Trades: Value, AI Power, Health Care
JPMorgan’s October stock picks spotlight American Express, Liberty Energy and Thermo Fisher, opening ETF plays across value, AI power and health care.
msn.com
Half of 'Big Money' managers say the AI boom has years left to run
The optimists cite robust earnings growth; the pessimists see a bubble in danger of bursting. Plus, the pros’ forecasts for ...
zeebiz.com
GRSE Share Price: Navratna Defence PSU bags Rs 53,866 crore warship contracts; Stock jumps over 3% – Details
Shares of Navratna CPSE Garden Reach Shipbuilders & Engineers (GRSE) rose over 3 per cent on Monday, November 2, after the ...
msn.com
Diwali picks: HAL, Kotak Bank, TechM, Sona BLW, Auro Pharma among top picks for upto 50% upside
Axis Securities shares 12 Diwali Muhurat stock picks for Samvat 2083, including Aurobindo Pharma, HAL, Kotak Bank and Tech ...