

Green Thumb Industries Inc. GTBIF
6.58 USD +0.02 (+0.29%)
At closeNov 11, 2026, 4:00 PM EST
6.52 Day range 6.72
5.29 52-week range 10.43
- YTD
- -18.17%
- 1 year
- -9.26%
- Market cap
- 1.44B
- EPS (ttm)
- 0.42
- P/E ratio
- 15.66
- YTD return
- -18.17%
- 1-year return
- -9.26%
- Volume
- 69.88K
- Avg volume
- 502.68K
- Open
- 6.56
- Previous close
- 6.56
- Day's range
- 6.52 – 6.72
- 52-week range
- 5.29 – 10.43
- Earnings date
- Nov 4, 2026
5D -0.34 (-4.93%)
Next earnings
Nov 4, 2026
Expected Nov 4, 2026. Consensus EPS estimate 0.01.
Earnings
| Report date | Quarter ending | EPS estimate | EPS reported | Surprise | Surprise % |
|---|---|---|---|---|---|
| Nov 4, 2026 | Sep 30, 2026 | 0.01 | — | — | — |
| Aug 4, 2026 | Jun 30, 2026 | 0.01 | 0.02 | +0.01 | +100.00% |
| May 6, 2026 | Mar 31, 2026 | 0.01997 | 0.07 | +0.05 | +250.53% |
| Feb 25, 2026 | Dec 31, 2025 | 0.01275 | 0.35 | +0.34 | +2,645.10% |
| Nov 5, 2025 | Sep 30, 2025 | 0.03 | 0.04 | +0.01 | +33.33% |
| Aug 6, 2025 | Jun 30, 2025 | 0.04 | -0.01 | -0.05 | -125.00% |
News
 Should You Buy GTBIF Stock Following Q3 Earnings Results?
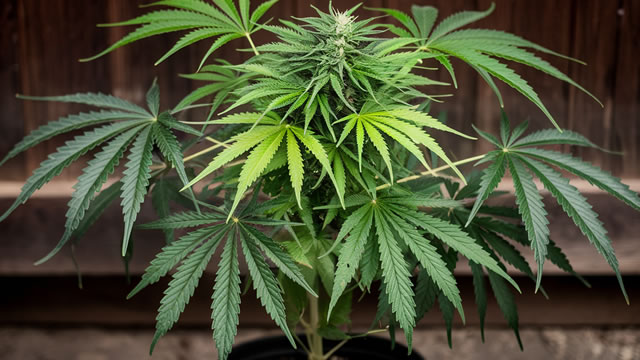 Green Thumb Ended Its String of Profitable Quarters. Is the Stock a Buy?
 Green Thumb Industries Inc. (GTBIF) Q3 2026 Earnings Call Transcript
 'Trump to sign executive order reclassifying marijuana: Officials' -ABC Report
 Congress Ended The Shutdown — But At The Cost Of Re-Criminalizing These THC Products In A Last-Minute Deal That Could Reshape The Cannabis Industry
 Cannabis Stock Movers For July 15, 2025
- Bullish Sentiment Across The Cannabis Space - Check Full Movers For July 9, 2025
- Cannabis Stock Gainers And Losers From June 25, 2025
 'GOP-Led Congressional Panel Demands Investigation On Biden's Marijuana Rescheduling Process, Citing 'Deviations' And 'Mental Health Hazards'' -Marijuana Moment Report
 Marijuana Stock Movers For May 21, 2025
Your note
Sign in to keep a note on GTBIF — it syncs with the Stock Master app.