

Goodman Group GMGSF
18.68 USD +0.32 (+1.74%)
Nov 4, 2026, 10:21 AM EST
18.68 Day range 18.90
16.08 52-week range 23.57
- YTD
- -11.68%
- 1 year
- -8.79%
- Market cap
- 38.38B
- EPS (ttm)
- 0.90
- P/E ratio
- 20.76
- YTD return
- -11.68%
- 1-year return
- -8.79%
- Volume
- 1.80K
- Avg volume
- 1.86K
- Open
- 18.90
- Previous close
- 18.36
- Day's range
- 18.68 – 18.90
- 52-week range
- 16.08 – 23.57
- Earnings date
- Aug 20, 2026
2Y -5.15 (-21.73%)
Next earnings
Aug 20, 2026
Expected Aug 20, 2026. Consensus EPS estimate 0.4911.
Earnings
| Report date | Quarter ending | EPS estimate | EPS reported | Surprise | Surprise % |
|---|---|---|---|---|---|
| Aug 20, 2026 | Jun 30, 2026 | 0.4911 | — | — | — |
| Feb 18, 2026 | Dec 31, 2025 | 0.3625 | 0.3903 | +0.03 | +7.67% |
| Aug 20, 2025 | Jun 30, 2025 | 0.3585 | 0.4435 | +0.09 | +23.71% |
| Feb 18, 2025 | Dec 30, 2024 | 0.3442 | 0.2533 | -0.09 | -26.41% |
| Aug 15, 2024 | Jun 30, 2024 | 0.32 | 0.04255 | -0.28 | -86.70% |
| May 8, 2024 | Dec 30, 2023 | 0.3566 | -0.07911 | -0.44 | -122.18% |
News
 Goodman Group (OTCMKTS:GMGSF) Stock Price Up 2.5% – What’s Next?
 Goodman Group Stapled Securities (GMGSF) Q4 2026 Earnings Call Transcript
 Goodman Group Announces Results of Cash Tender Offer for its 3.700% Guaranteed Senior Notes due 2028
 Goodman Group Announces Pricing of Cash Tender Offer for its 3.700% Guaranteed Senior Notes due 2028
 Goodman Group Announces Cash Tender Offer
 DataBank and Goodman Group Partner to Open New Landmark Data Center in Los Angeles
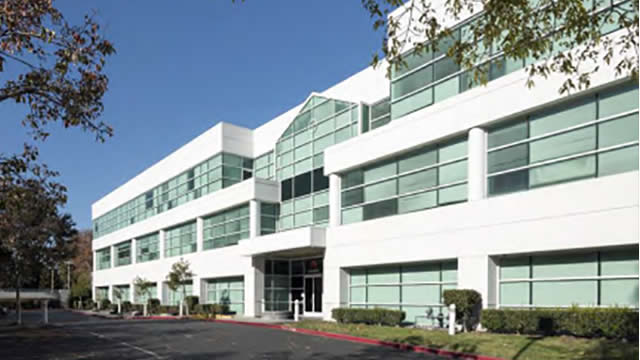 Baron Real Estate Fund Q4 2025 Portfolio Activity
 Goodman Group Stapled Securities (GMGSF) Q2 2026 Earnings Call Transcript
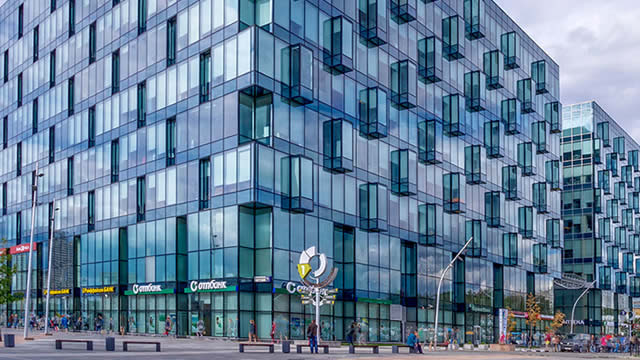 Goodman Group and Canada Pension Plan to establish $9.3 billion European data center partnership
 Goodman Group Stapled Securities (GMGSF) Shareholder/Analyst Call Transcript
Your note
Sign in to keep a note on GMGSF — it syncs with the Stock Master app.