

General Motors Company GM
Nov 11, 2026, 3:14 PM EST
- YTD
- +9.07%
- 1 year
- +24.54%
- Market cap
- 74.81B
- Revenue (ttm)
- 186.95B
- Profit margin
- 2.12%
- EPS (ttm)
- 4.57
- Shares out
- 849.00M
- P/E ratio
- 19.41
- Forward P/E
- 6.00
- Dividend
- 0.72 (0.78%)
- Ex-dividend date
- Dec 3, 2026
- YTD return
- +9.07%
- 1-year return
- +24.54%
- Volume
- 1.67M
- Avg volume
- 7.34M
- Open
- 88.40
- Previous close
- 88.69
- Day's range
- 87.98 – 88.92
- 52-week range
- 67.91 – 92.43
- Beta
- 1.42
- Analysts
- Buy
- Price target
- 101.09 (+14.0%)
- Earnings date
- Jan 27, 2027
5D -4.37 (-4.69%)
Key statistics
- Enterprise value
- 180.24B
- PEG ratio
- 0.28
- Price / sales
- 0.40
- Price / book
- 1.20
- Dividend yield
- 0.80%
- Payout ratio
- 15.10%
- Revenue growth
- 2.90%
- Free cash flow
- 28.52B
- Total cash
- 27.80B
- Total debt
- 130.71B
- Return on equity
- 6.28%
- Short % of float
- 2.54%
- 50-day average
- 83.43
- 200-day average
- 80.84
Analyst view
Consensus: buy
- Target (low)
- 75.00
- Target (mean)
- 101.09
- Target (high)
- 132.00
- Strong buy7
- Buy13
- Hold4
- Sell0
- Strong sell0
Next earnings
Jan 27, 2027
Expected Jan 27, 2027. Consensus EPS estimate 2.54.
Financials — quick view
Earnings
| Report date | Quarter ending | EPS estimate | EPS reported | Surprise | Surprise % |
|---|---|---|---|---|---|
| Jan 27, 2027 | Dec 30, 2026 | 2.60 | — | — | — |
| Oct 20, 2026 | Sep 30, 2026 | 3.69 | 3.70 | +0.01 | +0.27% |
| Jul 21, 2026 | Jun 30, 2026 | 3.19 | 3.57 | +0.38 | +11.91% |
| Apr 28, 2026 | Mar 31, 2026 | 2.61 | 3.70 | +1.09 | +41.76% |
| Jan 27, 2026 | Dec 31, 2025 | 2.26 | 2.51 | +0.25 | +11.06% |
| Oct 21, 2025 | Sep 30, 2025 | 2.29 | 2.80 | +0.51 | +22.27% |
Upgrades / downgrades
| Date | Firm | Action | From | To |
|---|---|---|---|---|
| Oct 28, 2026 | Tigress Financial | main | Strong Buy | Strong Buy |
| Oct 21, 2026 | UBS | main | Buy | Buy |
| Oct 21, 2026 | Goldman Sachs | main | Buy | Buy |
| Oct 21, 2026 | TD Cowen | reit | Buy | Buy |
| Oct 21, 2026 | Barclays | main | Overweight | Overweight |
| Oct 21, 2026 | RBC Capital | main | Outperform | Outperform |
About General Motors Company
General Motors Company designs, builds, and sells trucks, crossovers, cars, and automobile parts worldwide. It operates through GM North America, GM International, and GM Financial segments. The company markets its vehicles primarily under the Buick, Cadillac, Chevrolet, GMC, Baojun, and Wuling brand names. In addition, it sells trucks, crossovers, cars, and automobile parts through retail dealers, distributors and dealers, as well as to fleet customers, including daily rental car companies, commercial fleet customers, leasing companies, and governments. Further, the company offers various range of after-sale services through dealer network, such as maintenance, light repairs, collision repairs, vehicle accessories, and extended service warranties. Additionally, it provides automotive financing; and software-enabled services and subscriptions. General Motors Company was founded in 1908 and is based in Detroit, Michigan.
- Sector
- Consumer Cyclical
- Industry
- Auto Manufacturers
- Country
- United States
- Website
- gm.com
News
 America’s Biggest Lithium Bet Just Got $900 Million Pricier
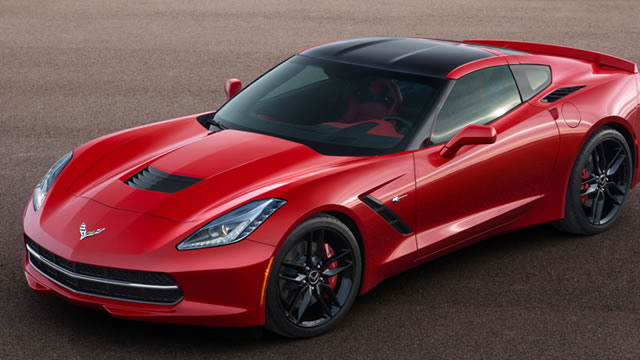 Is Trending Stock General Motors Company (GM) a Buy Now?
 General Fusion Expands Executive Leadership with Appointment of David Janashvili as Chief Financial Officer
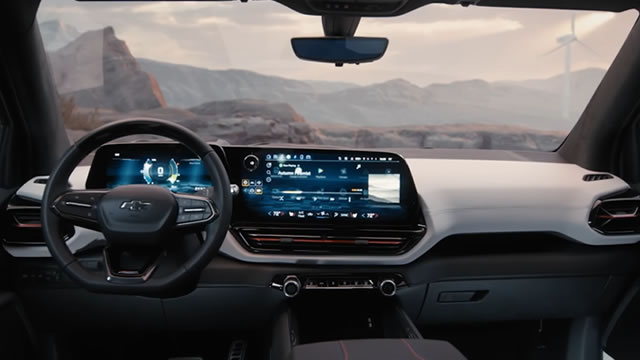 Can OnStar and Super Cruise Drive GM's Digital Revenue Growth?
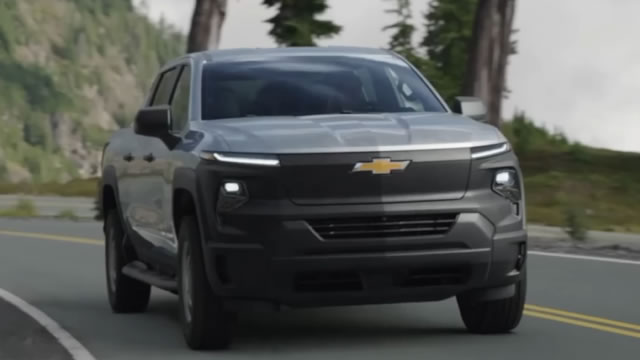 Can GM's Next-Generation Pickups Support Growth in 2027?
 Ford Yields Nearly 5%. GM Is Buying Back $20 Billion in Stock.
 EV Company News For The Month Of October 2026
 ‘Another Failure For Tesla’: Ross Gerber Slams Elon Musk Amid Cybertruck Shutdown Plans, Gary Black Calls It a ‘Missed Opportunity’
 Nasdaq 100 Has Worst Day Since 2020, Jobs Beat Keeps Fed Hike Alive: This Week on Wall Street
 5 Companies Buying Back Their Own Stock Hand Over Fist As the Stock Market Sells Off
Your note
Sign in to keep a note on GM — it syncs with the Stock Master app.
Insider holders
| Insider | Relation | Latest transaction | Date | Shares held |
|---|---|---|---|---|
| ANDERSON STERLING | Officer | Conversion of Exercise of derivative security | Jul 28, 2026 | 59,853 |
| BARRA MARY TERESA | Chief Executive Officer | Sale | Jul 27, 2026 | 428,994 |
| DIXTON GRANT MICHAEL | Officer | Sale | Aug 2, 2026 | 54,992 |
| GLIDDEN CRAIG B | General Counsel | Sale | Nov 17, 2024 | 122,465 |
| HARVEY RORY | Officer | Sale | Jul 26, 2026 | 28,513 |
| HATTO CHRISTOPHER | Officer | Sale | Jul 27, 2026 | 18,899 |
Institution ownership
| Holder | % held | Shares | Value | Reported |
|---|---|---|---|---|
| Blackrock Inc. | 9.16% | 77,309,218 | 6.86B | Jun 29, 2026 |
| Vanguard Capital Management LLC | 6.98% | 58,893,656 | 5.22B | Jun 29, 2026 |
| State Street Corporation | 5.27% | 44,441,119 | 3.94B | Jun 29, 2026 |
| Vanguard Portfolio Management LLC | 4.50% | 37,937,650 | 3.36B | Jun 29, 2026 |
| Franklin Resources, Inc. | 3.71% | 31,303,928 | 2.78B | Jun 29, 2026 |
| Geode Capital Management, LLC | 2.50% | 21,085,627 | 1.87B | Sep 29, 2026 |
Fund ownership
| Holder | % held | Shares | Value | Reported |
|---|---|---|---|---|
| VANGUARD INDEX FUNDS-Vanguard Total Stock Market Index Fund | 3.39% | 28,621,720 | 2.54B | Jun 29, 2026 |
| VANGUARD INDEX FUNDS-Vanguard 500 Index Fund | 2.77% | 23,364,391 | 2.07B | Jun 29, 2026 |
| VANGUARD INDEX FUNDS-Vanguard Mid-Cap Index Fund | 2.32% | 19,537,218 | 1.73B | Jun 29, 2026 |
| iShares Trust-iShares Core S&P 500 ETF | 1.39% | 11,692,160 | 1.04B | Sep 29, 2026 |
| PUTNAM LARGE CAP VALUE FUND | 1.35% | 11,357,227 | 1.01B | Jul 30, 2026 |
| Fidelity Concord Street Trust-Fidelity 500 Index Fund | 1.35% | 11,403,341 | 1.01B | Sep 29, 2026 |