

Gelesis Holdings, Inc. GLS
At closeApr 10, 2023, 4:00 PM EDT
52-week range unavailable
- Market cap
- 11.63M
- Revenue (ttm)
- 25.77M
- Profit margin
- -216.48%
- Shares out
- 73.33M
- Forward P/E
- -0.59
- Volume
- 185.17K
- Open
- 0.15
- Previous close
- 0.1586
- Day's range
- 0.145 – 0.1622
- Beta
- 0.99
- Analysts
- Hold
- Price target
- 0.45 (+183.7%)
- Earnings date
- Mar 28, 2023
Key statistics
- Enterprise value
- 79.03M
- PEG ratio
- 0.00
- Price / sales
- 0.45
- Price / book
- 0.00
- Dividend yield
- 0.00%
- Payout ratio
- 0.00%
- Revenue growth
- -9.10%
- Free cash flow
- -58.60M
- Total cash
- 7.41M
- Total debt
- 62.26M
- Return on equity
- 0.00%
- Short % of float
- 2.53%
- 50-day average
- 0.183248
- 200-day average
- 0.612698
Analyst view
Consensus: hold
- Strong buy0
- Buy0
- Hold1
- Sell0
- Strong sell0
Next earnings
Mar 28, 2023
Expected Mar 28, 2023. Consensus EPS estimate 0.00.
Earnings
| Report date | Quarter ending | EPS estimate | EPS reported | Surprise | Surprise % |
|---|---|---|---|---|---|
| Mar 28, 2023 | Dec 1, 2022 | 0.00 | — | — | — |
| Nov 14, 2022 | Sep 1, 2022 | 0.00 | — | — | — |
| Aug 15, 2022 | Jun 1, 2022 | 0.00 | — | — | — |
| May 12, 2022 | Mar 1, 2022 | 0.00 | — | — | — |
| Apr 22, 2010 | Mar 1, 2010 | 0.15 | — | — | — |
| Feb 25, 2010 | Dec 1, 2009 | 0.18 | — | — | — |
Upgrades / downgrades
| Date | Firm | Action | From | To |
|---|---|---|---|---|
| Sep 20, 2022 | Citigroup | init | — | Neutral |
About Gelesis Holdings, Inc.
Gelesis Holdings, Inc., a commercial stage biotherapeutics company, developing a biomimicry to treat the genesis of obesity and GI-related chronic diseases. It also offers PLENITY, an orally administered, non-stimulant, and non-systemic aid for weight management. In addition, the company develops GS200 for weight loss in prediabetes and type 2 diabetes; and GS500 for functional constipation. Further, it develops pre-clinical product GS300 for non-alcoholic fatty liver disease/non-alcoholic steatohepatitis. Gelesis Holdings, Inc. was incorporated in 2006 and is headquartered in Boston, Massachusetts.
- Sector
- Healthcare
- Industry
- Biotechnology
- Country
- United States
- Website
- gelesis.com
News
 GLS Italy strengthens its network of pick-up points in partnership with Quadient
 Royal Mail's sister business GLS to buy 20% stake in Greece's ACS for $80 million
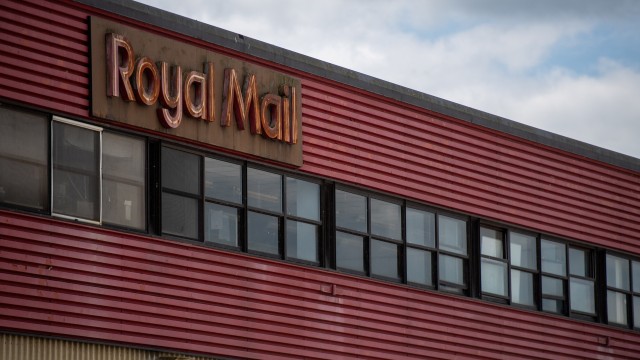 Royal Mail, GLS need sizable investments soon, billionaire suitor Kretinsky says
 Cell Reports Medicine Publication Demonstrates How Gelesis' Oral Therapeutic Hydrogel Promotes Weight Loss and Metabolic Health by Targeting the Gut-Liver Axis in Pre-Clinical Studies
 Why Kura Sushi Shares Are Trading Lower By Around 9%? Here Are Other Stocks Moving In Wednesday's Mid-Day Session
 Stocks That Hit 52-Week Lows On Wednesday
 Why Avaya Holdings Shares Are Trading Lower By 62%? Here Are 62 Stocks Moving In Friday's Mid-Day Session
- Why Express Shares Are Trading Higher By 39%? Here Are 50 Stocks Moving In Thursday's Mid-Day Session
 Why Drive Shack Shares Jumped Over 23%; Here Are 76 Biggest Movers From Yesterday
 Why TuanChe Shares Are Trading Lower By 76%? Here Are 48 Stocks Moving In Monday's Mid-Day Session
Your note
Sign in to keep a note on GLS — it syncs with the Stock Master app.
Insider holders
| Insider | Relation | Latest transaction | Date | Shares held |
|---|---|---|---|---|
| ABRAHAM DAVID J.D. | General Counsel | Stock Award(Grant) | May 5, 2022 | 256,437 |
| CAVANAUGH KATHRYN | Director | Stock Award(Grant) | May 5, 2022 | 61,639 |
| CHIQUETTE ELAINE PHARM.D. | Officer | Stock Award(Grant) | Jun 7, 2022 | 263,079 |
| CHRISTOPHER CLAYTON | Director | Stock Award(Grant) | May 5, 2022 | 510,768 |
| FONTEYNE PAUL R | Director | Stock Award(Grant) | May 5, 2022 | 53,832 |
| KUCHERLAPATI RAJU S | Director | Purchase | Nov 20, 2022 | 190,264 |
Institution ownership
| Holder | % held | Shares | Value | Reported |
|---|---|---|---|---|
| Vanguard Group, Inc. (The) | 4.02% | 2,944,423 | 466.99K | Dec 30, 2022 |
| Allianz Asset Management GmbH | 3.50% | 2,563,876 | 406.63K | Dec 30, 2022 |
| Vitruvian Partners, LLP | 2.56% | 1,876,106 | 297.55K | Dec 30, 2022 |
| Neuberger Berman Group, LLC | 1.51% | 1,107,985 | 175.73K | Dec 30, 2022 |
| Blackrock Inc. | 1.09% | 799,156 | 126.75K | Dec 30, 2022 |
| Northeast Financial Consultants Inc | 0.54% | 395,035 | 62.65K | Dec 30, 2022 |
Fund ownership
| Holder | % held | Shares | Value | Reported |
|---|---|---|---|---|
| Vanguard Total Stock Market Index Fund | 3.39% | 2,478,100 | 393.03K | Sep 29, 2022 |
| Vanguard Extended Market Index Fund | 0.54% | 394,479 | 62.56K | Sep 29, 2022 |
| iShares Russell 2000 Value ETF | 0.24% | 175,699 | 27.86K | Dec 30, 2022 |
| Fidelity Extended Market Index Fund | 0.17% | 126,692 | 20.09K | Nov 29, 2022 |
| Bridgeway Funds Inc-Ultra Small Company Market Fund | 0.10% | 74,300 | 11.78K | Sep 29, 2022 |
| Schwab Capital Trust-Small Cap Index Fund | 0.05% | 35,034 | 5.56K | Oct 30, 2022 |