

Ferro Corporation FOE
Apr 24, 2025, 3:47 PM EDT
52-week range unavailable
- Market cap
- 1.84B
- Revenue (ttm)
- 1.13B
- Profit margin
- 13.21%
- Shares out
- 83.75M
- Forward P/E
- 15.72
- Volume
- 1.25M
- Open
- 21.97
- Previous close
- 22.01
- Day's range
- 21.96 – 22.01
- Beta
- 1.42
- Analysts
- Hold
- Price target
- 22.00 (-0.0%)
- Earnings date
- May 10, 2022
Key statistics
- Enterprise value
- 2.06B
- PEG ratio
- 0.75
- Price / sales
- 1.64
- Price / book
- 3.42
- Dividend yield
- 0.00%
- Payout ratio
- 0.00%
- Revenue growth
- 2.50%
- Free cash flow
- 331.87M
- Total cash
- 71.49M
- Total debt
- 277.65M
- Return on equity
- 14.83%
- Short % of float
- 8.03%
- 50-day average
- 21.74
- 200-day average
- 21.27
Analyst view
Consensus: hold
- Strong buy1
- Buy5
- Hold1
- Sell0
- Strong sell0
Next earnings
May 10, 2022
Expected May 10, 2022. Consensus EPS estimate 0.27.
Financials — quick view
Earnings
| Report date | Quarter ending | EPS estimate | EPS reported | Surprise | Surprise % |
|---|---|---|---|---|---|
| May 10, 2022 | Mar 1, 2022 | 0.00 | — | — | — |
| Mar 1, 2022 | Dec 1, 2021 | 0.27 | — | — | — |
| Nov 3, 2021 | Sep 1, 2021 | 0.31 | — | — | — |
| Aug 4, 2021 | Jun 1, 2021 | 0.31 | — | — | — |
| May 11, 2021 | Mar 1, 2021 | 0.24 | — | — | — |
| Feb 25, 2021 | Dec 1, 2020 | 0.21 | — | — | — |
Upgrades / downgrades
| Date | Firm | Action | From | To |
|---|---|---|---|---|
| May 13, 2021 | Seaport Global | down | Buy | Neutral |
| May 12, 2021 | Gabelli & Co. | down | Buy | Sell |
| May 12, 2021 | Deutsche Bank | down | Buy | Hold |
| May 12, 2021 | JP Morgan | down | Neutral | Underweight |
| Aug 6, 2020 | Wells Fargo | main | — | Equal-Weight |
| Apr 16, 2020 | Deutsche Bank | main | — | Buy |
About Ferro Corporation
Ferro Corporation produces and markets specialty materials in Europe, the Middle East, Africa, the Asia Pacific, and the Americas region. The company operates through two segments, Functional Coatings and Color Solutions. It offers frits, porcelain and other glass enamels, glazes, stains, decorating colors, pigments, inks, polishing materials, dielectrics, electronic glasses, and other specialty coatings. The company's products are used in appliances, electronics, automotive, industrial products, building and renovation, packaging, consumer products, sanitary, construction, healthcare, food and beverage, information technology, energy, and defense industries. It markets and sells its products directly, as well as through agents and distributors. The company was incorporated in 1919 and is headquartered in Mayfield Heights, Ohio. As of April 21, 2022, Ferro Corporation operates as a subsidiary of Prince International Corporation.
- Sector
- Basic Materials
- Industry
- Specialty Chemicals
- Country
- United States
- Website
- ferro.com
News
 ‘HOLY TRINITY' LEADS EXCITING HYPERCARS AND SUPERCARS AT BROAD ARROW'S SECOND ANNUAL ZOUTE CONCOURS AUCTION
 Disney is poised to ramp its already booming advertising business. Rita Ferro is behind the push
 Black Swan Graphene and Ferro Announce Distribution and Sales Agreement
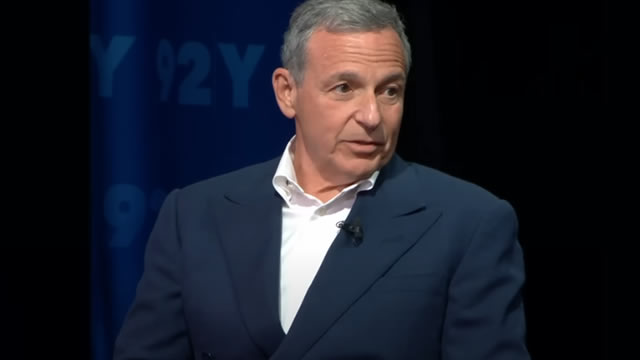 Disney Streaming Platforms Now Reach 164M Monthly Active Users, Ad Chief Rita Ferro Says
 A10 Networks Set to Join S&P SmallCap 600
 Prince International Corporation Completes Acquisition of Ferro Corporation
 CORRECTING and REPLACING MULTIMEDIA Ferro Corporation Reports Fourth Quarter and Full Year 2021 Results
 Ferro Corporation Reports Fourth Quarter and Full Year 2021 Results
 Ferro (FOE) Lags Q3 Earnings and Revenue Estimates
 CORRECTING and REPLACING Ferro Corporation Reports Third Quarter 2021 Results
Your note
Sign in to keep a note on FOE — it syncs with the Stock Master app.
Insider holders
| Insider | Relation | Latest transaction | Date | Shares held |
|---|---|---|---|---|
| BARNA JAMES | Officer | Conversion of Exercise of derivative security | Feb 27, 2019 | 9,835 |
| DUESENBERG MARK HUGO | General Counsel | Conversion of Exercise of derivative security | Feb 27, 2022 | 154,909 |
| HENKE ANDREW T. | Officer | Conversion of Exercise of derivative security | Feb 17, 2022 | 9,953 |
| LORBER DAVID A | Director | Purchase | May 13, 2019 | 22,000 |
| OGILVIE MARRAN H | Director | Purchase | Nov 12, 2017 | 2,000 |
| ROSS ANDREW M | Director | Purchase | May 12, 2019 | 9,000 |
Institution ownership
| Holder | % held | Shares | Value | Reported |
|---|---|---|---|---|
| Blackrock Inc. | 15.07% | 12,466,025 | 272.13M | Dec 30, 2021 |
| Vanguard Group, Inc. (The) | 10.89% | 9,010,244 | 196.69M | Dec 30, 2021 |
| Magnetar Financial LLC | 6.12% | 5,061,112 | 110.48M | Dec 30, 2021 |
| Versor Investments, LP | 4.98% | 4,118,840 | 89.91M | Dec 30, 2021 |
| Gamco Investors Inc | 4.24% | 3,505,126 | 76.52M | Dec 30, 2021 |
| Dimensional Fund Advisors LP | 3.67% | 3,036,514 | 66.29M | Dec 30, 2021 |
Fund ownership
| Holder | % held | Shares | Value | Reported |
|---|---|---|---|---|
| iShares Core S&P Smallcap ETF | 7.03% | 5,819,561 | 126.87M | Jan 30, 2022 |
| Vanguard Total Stock Market Index Fund | 2.84% | 2,346,254 | 51.22M | Dec 30, 2021 |
| Vanguard Small-Cap Index Fund | 2.53% | 2,090,688 | 45.64M | Dec 30, 2021 |
| EQ Advisors Trust-1290 VT Gamco Small Company Value Port | 2.39% | 1,975,000 | 43.11M | Dec 30, 2021 |
| iShares Russell 2000 ETF | 2.28% | 1,888,795 | 41.18M | Jan 30, 2022 |
| Vanguard Small Cap Value Index Fund | 1.60% | 1,320,963 | 28.84M | Dec 30, 2021 |