

Evergy, Inc. EVRG
88.44 USD +0.45 (+0.51%)
At closeNov 10, 2026, 4:00 PM EST
87.34 -1.10 -1.24%
After hours · Nov 10, 4:00 PM ET
86.78 Day range 88.61
71.41 52-week range 89.66
- YTD
- +22.00%
- 1 year
- +15.50%
- Market cap
- 20.74B
- Revenue (ttm)
- 6.38B
- Profit margin
- 16.67%
- EPS (ttm)
- 4.49
- Shares out
- 234.50M
- P/E ratio
- 19.70
- Forward P/E
- 19.36
- Dividend
- 2.89 (3.28%)
- Ex-dividend date
- Nov 19, 2026
- YTD return
- +22.00%
- 1-year return
- +15.50%
- Volume
- 2.46M
- Avg volume
- 2.27M
- Open
- 87.41
- Previous close
- 87.99
- Day's range
- 86.78 – 88.61
- 52-week range
- 71.41 – 89.66
- Beta
- 0.47
- Analysts
- Buy
- Price target
- 91.50 (+3.5%)
- Earnings date
- Feb 18, 2027
5D +4.13 (+4.90%)
Key statistics
- Enterprise value
- 36.89B
- PEG ratio
- 2.26
- Price / sales
- 3.25
- Price / book
- 1.88
- Dividend yield
- 3.28%
- Payout ratio
- 61.92%
- Revenue growth
- 15.80%
- Free cash flow
- -1.47B
- Total cash
- 18.70M
- Total debt
- 16.22B
- Return on equity
- 10.06%
- Short % of float
- 9.27%
- 50-day average
- 81.94
- 200-day average
- 82.38
Analyst view
Consensus: buy
Buy
Price target (mean) 91.50 +3.5% upside
Now 88.44
- Target (low)
- 80.00
- Target (mean)
- 91.50
- Target (high)
- 100.00
Ratings (0m) 16 11 buy · 4 hold · 1 sell
- Strong buy2
- Buy9
- Hold4
- Sell0
- Strong sell1
Next earnings
Feb 18, 2027
Expected Feb 18, 2027. Consensus EPS estimate 0.35667.
Financials — quick view
EVRG Revenue — quarterly 2.10B
EVRG Net income — quarterly 612.90M
EVRG EPS — quarterly 2.65
Earnings
| Report date | Quarter ending | EPS estimate | EPS reported | Surprise | Surprise % |
|---|---|---|---|---|---|
| Feb 18, 2027 | Dec 30, 2026 | 0.40 | — | — | — |
| Nov 5, 2026 | Sep 30, 2026 | 2.33 | 2.58 | +0.25 | +10.73% |
| Aug 6, 2026 | Jun 30, 2026 | 0.811 | 0.88 | +0.07 | +8.51% |
| May 7, 2026 | Mar 31, 2026 | 0.606 | 0.69 | +0.08 | +13.86% |
| Feb 19, 2026 | Dec 31, 2025 | 0.551 | 0.42 | -0.13 | -23.77% |
| Nov 6, 2025 | Sep 30, 2025 | 2.08 | 2.03 | -0.05 | -2.40% |
Upgrades / downgrades
| Date | Firm | Action | From | To |
|---|---|---|---|---|
| Oct 27, 2026 | Truist Securities | init | — | Buy |
| Oct 22, 2026 | TD Cowen | init | — | Buy |
| Oct 22, 2026 | HSBC | init | — | Buy |
| Oct 19, 2026 | Barclays | main | Overweight | Overweight |
| Oct 13, 2026 | BMO Capital | main | Outperform | Outperform |
| Jul 24, 2026 | Citigroup | main | Buy | Buy |
About Evergy, Inc.
Evergy, Inc., together with its subsidiaries, engages in the generation, transmission, distribution, and sale of electricity in the United States. The company generates electricity through coal, landfill gas, uranium, and natural gas and oil sources, as well as solar, wind, and other renewable sources. It serves residences, commercial firms, industrials, municipalities, and other electric utilities. The company was incorporated in 2017 and is headquartered in Kansas City, Missouri.
- Sector
- Utilities
- Industry
- Utilities - Regulated Electric
- Country
- United States
- Website
- investors.evergy.com
News
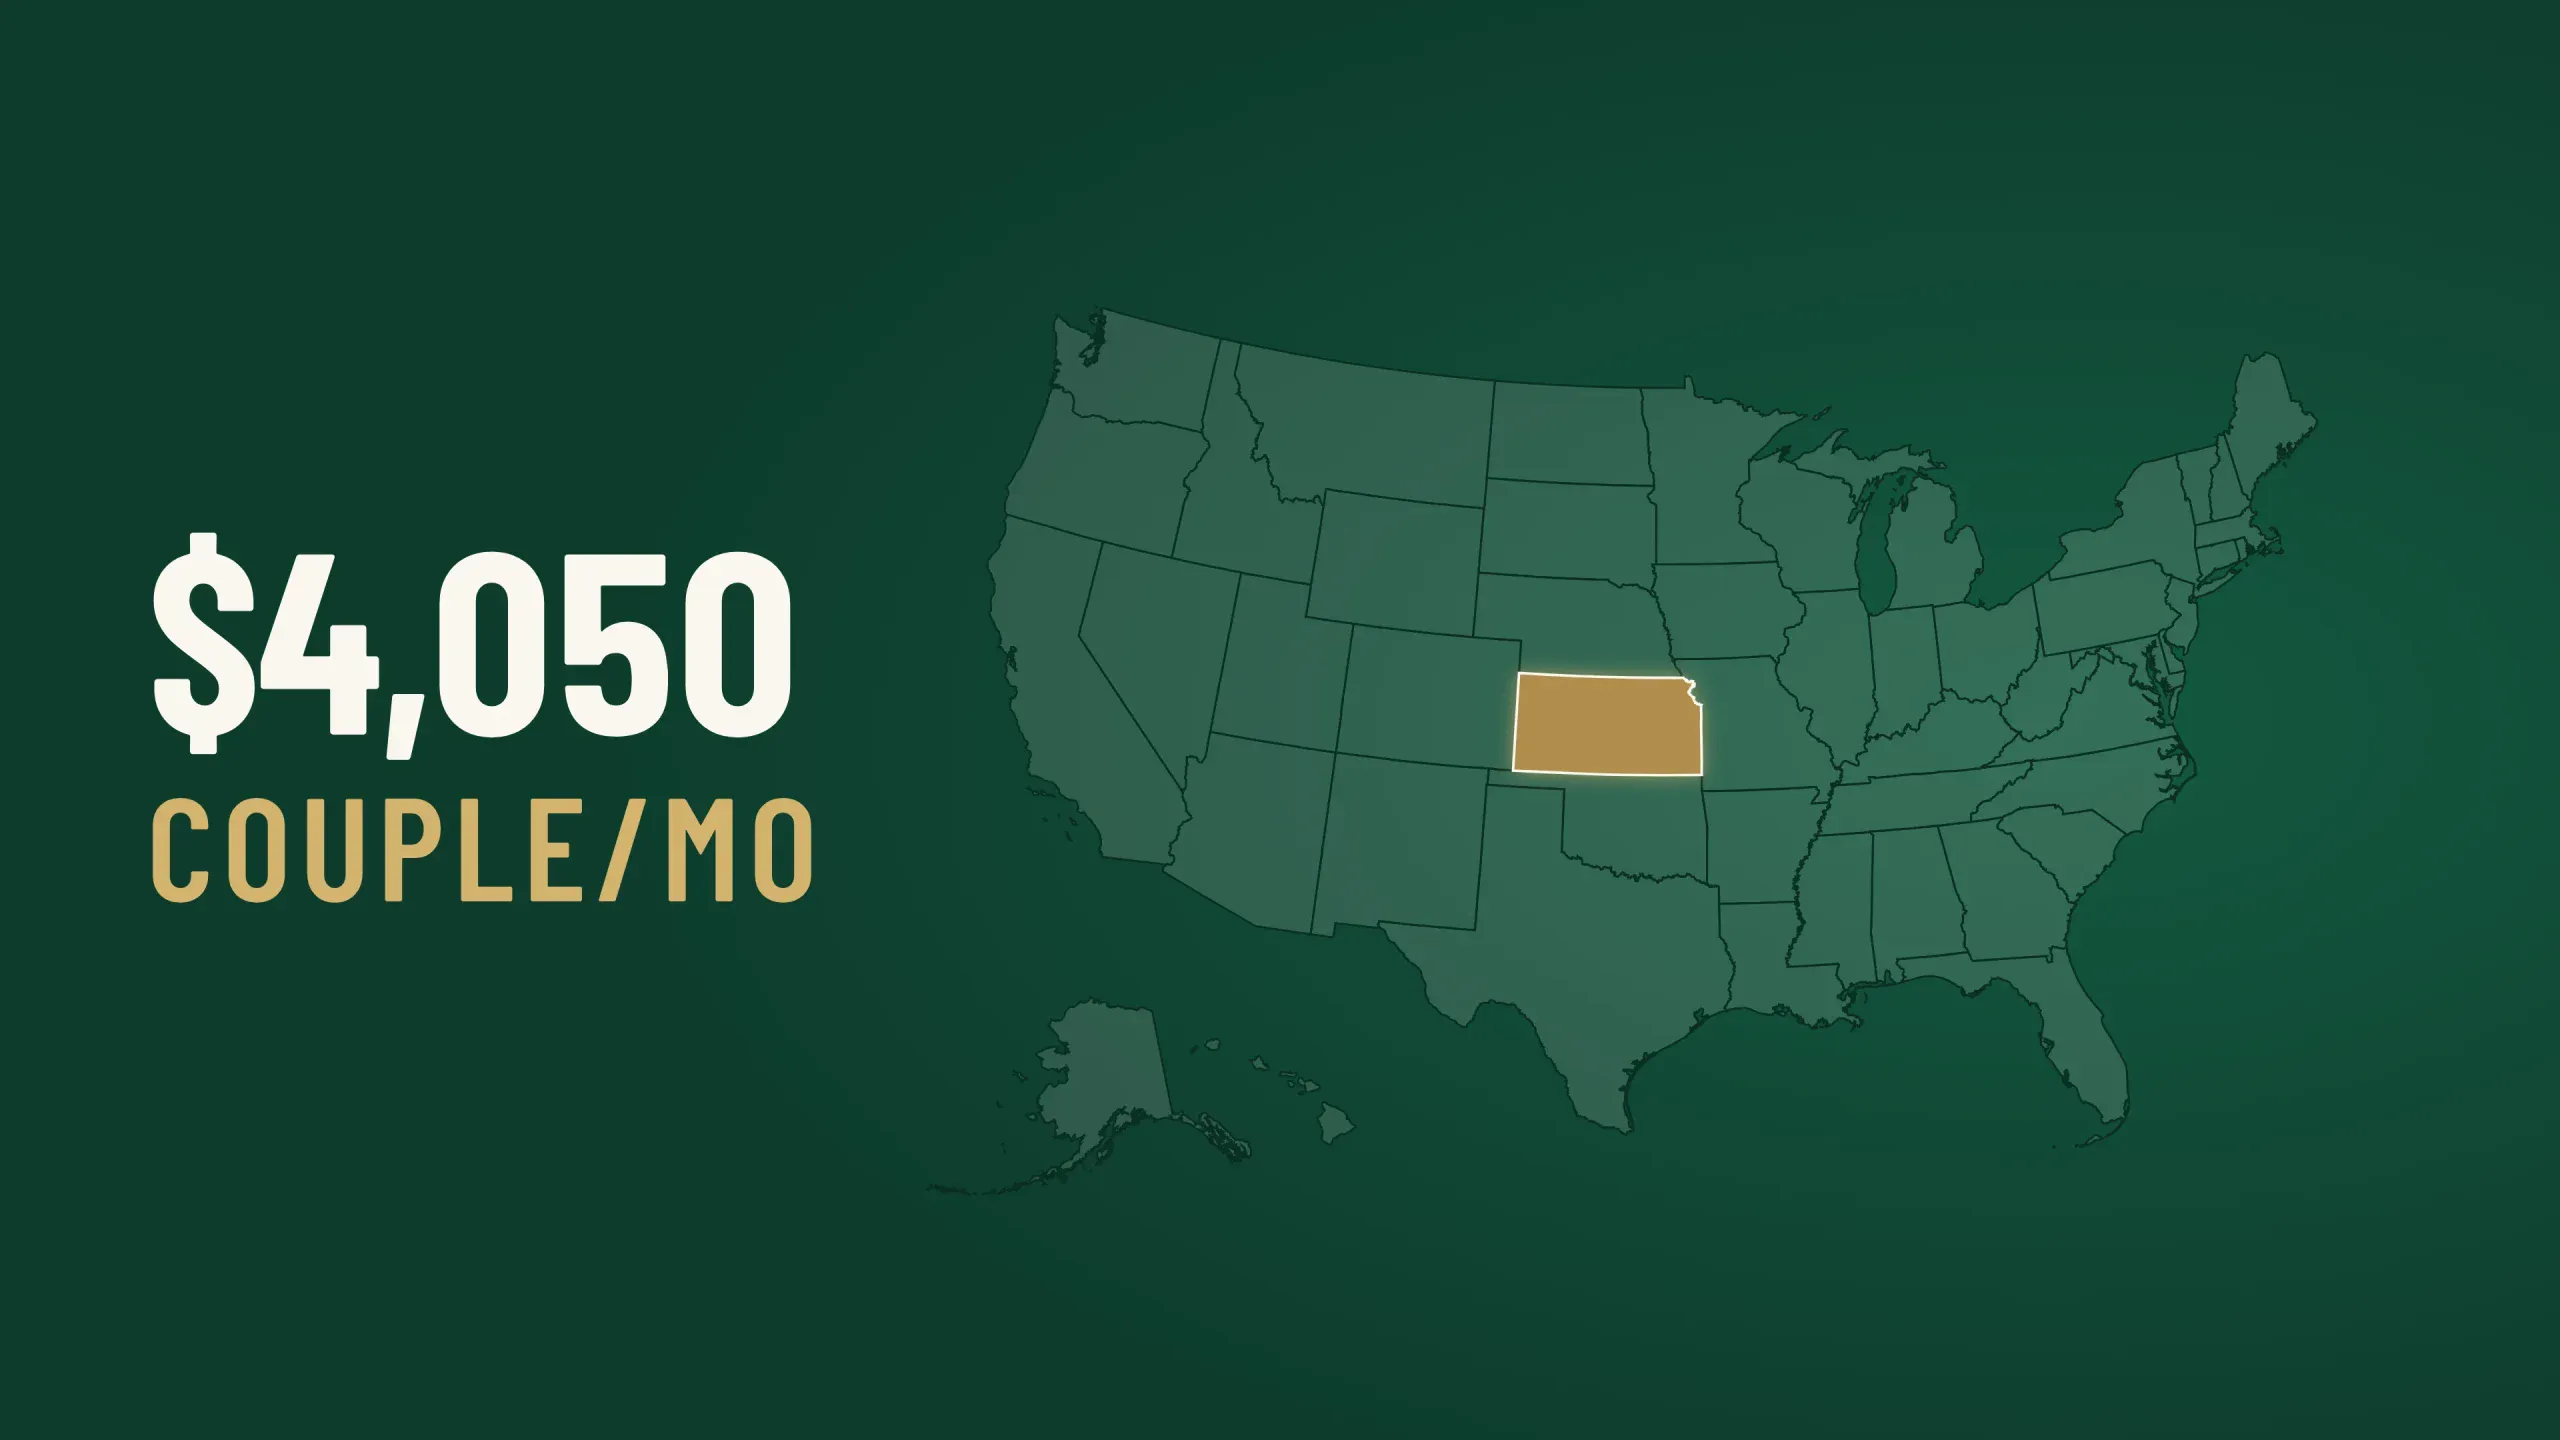 A Renter’s Retirement in Wichita, Kansas: What It Costs Without Owning a Home
 Are You Looking for a Top Momentum Pick? Why Evergy Inc (EVRG) is a Great Choice
 Dividend Announcements: October 31-November 6, 2026 (Part 2 Of 2)
 Evergy Inc. $EVRG Stock Position Raised by Alps Advisors Inc.
 Evergy, Inc. (EVRG) Q3 2026 Earnings Call Transcript
 Evergy Q3 Earnings Call Highlights
 Evergy's Q3 Earnings and Revenues Beat Estimates, '26 EPS View Raised
 Evergy Inc (EVRG) Q3 Earnings and Revenues Surpass Estimates
 Evergy Q3 2026 Earnings Call Transcript
 CORRECTION: Evergy Q3 Adj. EPS $2.58 Beats $2.31 Estimate, Sales $2.265B Beat $1.929B Estimate
Your note
Sign in to keep a note on EVRG — it syncs with the Stock Master app.
Insider holders
| Insider | Relation | Latest transaction | Date | Shares held |
|---|---|---|---|---|
| BRIDSON JOHN T | Officer | Conversion of Exercise of derivative security | Feb 26, 2026 | 45,717 |
| BUCKLER WILLIAM BRYAN | Chief Financial Officer | Conversion of Exercise of derivative security | Sep 30, 2026 | 19,432 |
| CAISLEY CHARLES A | Officer | Sale | Jun 14, 2026 | 38,266 |
| CAMPBELL DAVID A | Chief Executive Officer | Conversion of Exercise of derivative security | Feb 26, 2026 | 160,100 |
| HUMPHREY HEATHER A. SUVE | General Counsel | Sale | Mar 9, 2026 | 44,007 |
| ISAAC B ANTHONY | Director | Stock Award(Grant) | May 5, 2026 | 57,228 |
Institution ownership
| Holder | % held | Shares | Value | Reported |
|---|---|---|---|---|
| Blackrock Inc. | 12.20% | 27,996,513 | 2.48B | Jun 29, 2026 |
| State Street Corporation | 7.35% | 16,868,189 | 1.49B | Jun 29, 2026 |
| Vanguard Capital Management LLC | 6.39% | 14,657,069 | 1.30B | Jun 29, 2026 |
| Vanguard Portfolio Management LLC | 4.94% | 11,329,099 | 1.00B | Jun 29, 2026 |
| FMR, LLC | 3.73% | 8,557,681 | 756.84M | Jun 29, 2026 |
| Invesco Ltd. | 3.21% | 7,371,645 | 651.95M | Jun 29, 2026 |
Fund ownership
| Holder | % held | Shares | Value | Reported |
|---|---|---|---|---|
| VANGUARD INDEX FUNDS-Vanguard Total Stock Market Index Fund | 3.02% | 6,930,226 | 612.91M | Jun 29, 2026 |
| VANGUARD INDEX FUNDS-Vanguard 500 Index Fund | 2.60% | 5,972,238 | 528.18M | Jun 29, 2026 |
| VANGUARD INDEX FUNDS-Vanguard Small-Cap Index Fund | 2.18% | 5,004,654 | 442.61M | Jun 29, 2026 |
| Franklin Custodian Funds-FRANKLIN UTILITIES FUND | 1.81% | 4,150,000 | 367.03M | Jun 29, 2026 |
| SELECT SECTOR SPDR TRUST-State Street Utilities Select Sector SPDR ETF | 1.78% | 4,080,090 | 360.84M | Sep 29, 2026 |
| BLACKROCK EQUITY DIVIDEND FUND | 1.50% | 3,434,886 | 303.78M | Jul 30, 2026 |