

Evolution Petroleum Corporation EPM
Nov 5, 2026, 9:36 AM EST
- YTD
- -0.28%
- 1 year
- -19.41%
- Market cap
- 141.81M
- Revenue (ttm)
- 87.17M
- Profit margin
- 5.36%
- EPS (ttm)
- -0.08
- Shares out
- 33.60M
- Forward P/E
- 12.42
- Dividend
- 0.48 (13.30%)
- Ex-dividend date
- Dec 12, 2024
- YTD return
- -0.28%
- 1-year return
- -19.41%
- Volume
- 4.92K
- Avg volume
- 487.47K
- Open
- 3.64
- Previous close
- 3.52
- Day's range
- 3.53 – 3.54
- 52-week range
- 3.19 – 4.99
- Beta
- 0.86
- Price target
- 7.63 (+116.0%)
- Earnings date
- Feb 4, 2025
2Y -1.79 (-33.71%)
Key statistics
- Enterprise value
- 193.53M
- PEG ratio
- 0.00
- Price / sales
- 1.92
- Price / book
- 2.06
- Dividend yield
- 9.84%
- Payout ratio
- 342.86%
- Revenue growth
- 6.30%
- Free cash flow
- -24.35M
- Total cash
- 6.94M
- Total debt
- 39.53M
- Return on equity
- 5.51%
- Short % of float
- 2.88%
- 50-day average
- 5.51
- 200-day average
- 5.50
Analyst view
- Target (low)
- 7.00
- Target (mean)
- 7.63
- Target (high)
- 8.25
- Strong buy1
- Buy1
- Hold0
- Sell0
- Strong sell0
Next earnings
Feb 4, 2025
Expected Feb 4, 2025. Consensus EPS estimate 0.02.
Financials — quick view
Earnings
| Report date | Quarter ending | EPS estimate | EPS reported | Surprise | Surprise % |
|---|---|---|---|---|---|
| Feb 4, 2025 | Dec 1, 2024 | 0.06 | — | — | — |
| Nov 12, 2024 | Sep 1, 2024 | 0.04 | 0.02 | -0.02 | -50.00% |
| Sep 10, 2024 | Jun 1, 2024 | 0.06 | 0.03 | -0.03 | -50.00% |
| May 7, 2024 | Mar 1, 2024 | 0.03 | 0.03 | 0.00 | 0.00% |
| Feb 6, 2024 | Dec 1, 2023 | 0.10 | 0.03 | -0.07 | -70.00% |
| Nov 7, 2023 | Sep 1, 2023 | 0.08 | 0.04 | -0.04 | -50.00% |
Upgrades / downgrades
| Date | Firm | Action | From | To |
|---|---|---|---|---|
| Apr 4, 2024 | Roth MKM | main | Buy | Buy |
| Sep 18, 2023 | Roth MKM | reit | Buy | Buy |
| Nov 10, 2022 | Roth Capital | up | Neutral | Buy |
| Jul 12, 2022 | Northland Capital Markets | init | — | Outperform |
| Jul 6, 2022 | Roth Capital | down | Buy | Neutral |
| Oct 5, 2021 | Roth Capital | main | — | Buy |
About Evolution Petroleum Corporation
Evolution Petroleum Corporation, an energy company, engages in the development, production, ownership, and exploitation of onshore oil and gas properties in the United States. The company holds a non-operated interests in the SCOOP and STACK plays located in Central Oklahoma; the Chaveroo Field situated in Chaves and Roosevelt Counties, New Mexico; the Jonah Field located in Sublette County, Wyoming; the Williston Basin situated in Williston, North Dakota; the Barnett Shale field located in North Texas; the Hamilton Dome situated in Hot Springs County, Wyoming; and the Delhi Field, an onshore CO2-EOR project located in northeast Louisiana in Franklin, Madison, and Richland Parishes, as well as small overriding royalty interests in four onshore central Texas wells. The company was founded in 2003 and is based in Houston, Texas.
- Sector
- Energy
- Industry
- Oil & Gas E&P
- Country
- United States
- Website
- evolutionpetroleum.com
News
 Evolution Petroleum Schedules Fiscal First Quarter 2027 Earnings Release and Conference Call
 Evolution Petroleum: Capable Of Maintaining Its Dividend During FY 2027
 Evolution Petroleum: A 13% Yield Worth A Small Bet
 Evolution Petroleum Eyes Dividend Growth With Midland Royalty Deal
 Evolution Petroleum Eyes Dividend Growth With Midland Royalty Deal
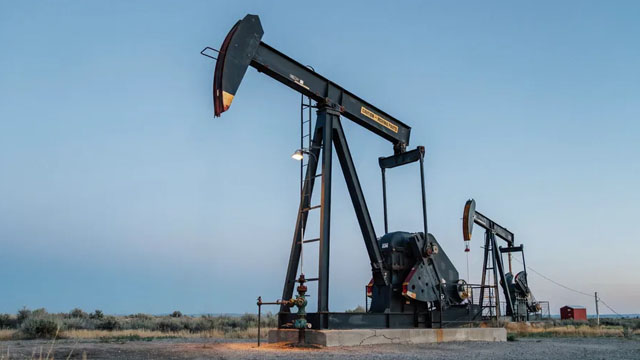 Evolution Petroleum Bets on Midland Royalties to Bolster Cash Flow and Dividend
 Evolution Petroleum Eyes Cash-Flow Growth With Midland Basin Royalty Deal
 Evolution Petroleum to Participate in Upcoming Investor Conferences
 Wall Street's Most Accurate Analysts Spotlight On 3 Energy Stocks Delivering High-Dividend Yields
 Wall Street's Most Accurate Analysts Spotlight On 3 Energy Stocks Delivering High-Dividend Yields
Your note
Sign in to keep a note on EPM — it syncs with the Stock Master app.
Insider holders
| Insider | Relation | Latest transaction | Date | Shares held |
|---|---|---|---|---|
| BEATTY KELLY M. | Officer | Stock Award(Grant) | Sep 16, 2024 | 64,367 |
| BIERRIA MYRA COLEMAN | Director | Stock Award(Grant) | Dec 4, 2024 | 61,908 |
| BUNCH JOHN MARK | Chief Operating Officer | Stock Award(Grant) | Sep 16, 2024 | 184,404 |
| DIPAOLO EDWARD JOHN JED | Director | Stock Award(Grant) | Dec 4, 2024 | 314,623 |
| DOZIER WILLIAM E | Director | Stock Award(Grant) | Dec 4, 2024 | 240,010 |
| HARGRAVE MARJORIE ANNE | Director | Stock Award(Grant) | Dec 4, 2024 | 93,778 |
Institution ownership
| Holder | % held | Shares | Value | Reported |
|---|---|---|---|---|
| Blackrock Inc. | 7.68% | 2,578,967 | 12.82M | Sep 29, 2024 |
| Wealthtrust Axiom, LLC | 5.08% | 1,705,138 | 8.47M | Sep 29, 2024 |
| Vanguard Group Inc | 4.72% | 1,585,903 | 7.88M | Sep 29, 2024 |
| Dimensional Fund Advisors LP | 4.23% | 1,420,757 | 7.06M | Sep 29, 2024 |
| River Road Asset Management, LLC | 3.94% | 1,323,211 | 6.58M | Sep 29, 2024 |
| Renaissance Technologies, LLC | 3.34% | 1,121,597 | 5.57M | Sep 29, 2024 |
Fund ownership
| Holder | % held | Shares | Value | Reported |
|---|---|---|---|---|
| Vanguard Total Stock Market Index Fund | 2.67% | 896,436 | 4.46M | Sep 29, 2024 |
| AMG Managers River Road Small Cap Value Fund | 2.48% | 832,335 | 4.14M | Oct 30, 2024 |
| iShares Russell 2000 ETF | 2.15% | 723,511 | 3.60M | Oct 30, 2024 |
| Vanguard Extended Market Index Fund | 1.33% | 446,295 | 2.22M | Sep 29, 2024 |
| Northern Lights Fd Tr II-North Star Micro Cap Fd | 1.27% | 425,000 | 2.11M | Aug 30, 2024 |
| Avantis U.S. Small Cap Value ETF | 1.20% | 402,194 | 2.00M | Sep 29, 2024 |