

Eagle Point Income Company EIC
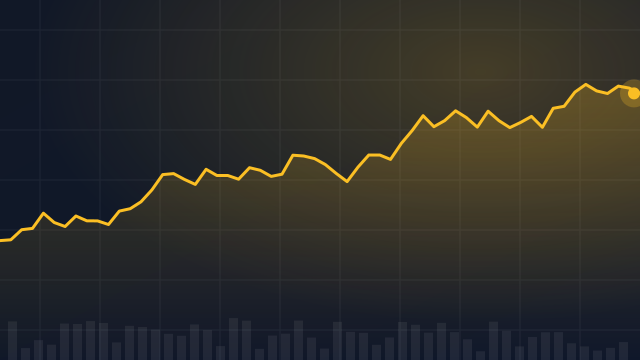
8.85 USD -0.02 (-0.28%)
Nov 4, 2026, 2:32 PM EST
8.84 Day range 9.29
8.63 52-week range 12.40
- YTD
- -22.48%
- 1 year
- -28.55%
- Market cap
- 207.27M
- Revenue (ttm)
- 35.54M
- Profit margin
- 132.61%
- EPS (ttm)
- -0.29
- Shares out
- 18.56M
- Forward P/E
- 7.88
- Dividend
- 2.40
- Ex-dividend date
- Dec 10, 2024
- YTD return
- -22.48%
- 1-year return
- -28.55%
- Volume
- 165.35K
- Avg volume
- 125.45K
- Open
- 8.95
- Previous close
- 8.87
- Day's range
- 8.84 – 9.29
- 52-week range
- 8.63 – 12.40
- Beta
- 0.48
- Price target
- 17.50 (+97.9%)
- Earnings date
- Aug 6, 2024
2Y -7.09 (-44.42%)
Key statistics
- Enterprise value
- 350.94M
- PEG ratio
- 0.00
- Price / sales
- 8.02
- Price / book
- 1.07
- Dividend yield
- 14.96%
- Payout ratio
- 53.56%
- Revenue growth
- 89.60%
- Free cash flow
- 9.89M
- Total cash
- 10.60M
- Total debt
- 109.22M
- Return on equity
- 26.44%
- Short % of float
- 0.28%
- 50-day average
- 15.82
- 200-day average
- 15.85
Analyst view
Price target (mean) 17.50
Ratings (0m) 1 1 buy · 0 hold · 0 sell
- Strong buy0
- Buy1
- Hold0
- Sell0
- Strong sell0
Next earnings
Aug 6, 2024
Expected Aug 6, 2024. Consensus EPS estimate 0.51.
Earnings
| Report date | Quarter ending | EPS estimate | EPS reported | Surprise | Surprise % |
|---|---|---|---|---|---|
| Aug 6, 2024 | Jun 1, 2024 | 0.00 | 0.44 | — | — |
| Aug 6, 2024 | Jun 1, 2024 | 0.00 | — | — | — |
| May 21, 2024 | Mar 1, 2024 | 0.00 | — | — | — |
| May 21, 2024 | Mar 1, 2024 | 0.00 | 0.56 | — | — |
| Nov 14, 2023 | Sep 1, 2023 | 0.00 | — | — | — |
| Nov 14, 2023 | Sep 1, 2023 | 0.00 | 0.38 | — | — |
Upgrades / downgrades
| Date | Firm | Action | From | To |
|---|---|---|---|---|
| Sep 3, 2024 | B. Riley Securities | init | — | Buy |
News
 Eagle Point Income Company Provides Estimates of Net Asset Value and Net Investment Income for the Quarter Ended September 30, 2026
 Pasqal recognized with an EIC Fund Award at the 2026 TechEU Equity Summit in Luxembourg
 Eagle Point Income Company Announces Redemption of 5.00% Series A Term Preferred Shares Due 2026
 Eagle Point Income: 19% Discount Makes The Common Stock A Buy
 Eagle Point Income Company Inc (EIC) Q2 2026 Earnings Call Transcript
 Eagle Point Income Q2 2026 Earnings Call: Complete Transcript
 Eagle Point Income Q2 EPS $0.37 Misses $0.47 Estimate, Sales $12.150M Beat $12.070M Estimate
 Eagle Point Income Company Inc. Announces Second Quarter 2026 Financial Results and Fourth Quarter 2026 Common and Preferred Distributions
 Eagle Point Income Q2 GAAP NII/Share $0.37 Beats $0.33 Estimate
 Eagle Point Income Company Inc. Schedules Release of Second Quarter 2026 Financial Results on Thursday, August 13, 2026
Your note
Sign in to keep a note on EIC — it syncs with the Stock Master app.
Institution ownership
| Holder | % held | Shares | Value | Reported |
|---|---|---|---|---|
| Enstar Group Limited | 29.05% | 3,764,580 | 57.82M | Sep 29, 2024 |
| Graypoint LLC | 1.28% | 165,323 | 2.54M | Sep 29, 2024 |
| Bard Associates Inc. | 0.95% | 123,075 | 1.89M | Sep 29, 2024 |
| Principal Securities, Inc. | 0.63% | 81,511 | 1.25M | Sep 29, 2024 |
| Envestnet Asset Management | 0.63% | 81,511 | 1.25M | Sep 29, 2024 |
| Morgan Stanley | 0.38% | 49,625 | 762.24K | Sep 29, 2024 |
Fund ownership
| Holder | % held | Shares | Value | Reported |
|---|---|---|---|---|
| Royce Global Financial Services Fund | 0.23% | 19,341 | 297.08K | Sep 29, 2023 |