

Duke Energy Corporation 5.625% DUKB
20.23 USD -0.25 (-1.22%)
Nov 5, 2026, 3:45 PM EST
20.13 Day range 20.54
19.72 52-week range 25.26
- YTD
- -17.76%
- 1 year
- -17.26%
- Market cap
- 15.93B
- YTD return
- -17.76%
- 1-year return
- -17.26%
- Volume
- 51.11K
- Avg volume
- 51.79K
- Open
- 20.40
- Previous close
- 20.48
- Day's range
- 20.13 – 20.54
- 52-week range
- 19.72 – 25.26
- Earnings date
- Nov 5, 2026
1Y -4.39 (-17.82%)
Key statistics
- Price / sales
- 0.00
- Dividend yield
- 0.00%
- Payout ratio
- 0.00%
- 50-day average
- 20.86
- 200-day average
- 23.04
Next earnings
Nov 5, 2026
Expected Nov 5, 2026. Consensus EPS estimate 0.00.
Earnings
| Report date | Quarter ending | EPS estimate | EPS reported | Surprise | Surprise % |
|---|---|---|---|---|---|
| Nov 5, 2026 | Sep 30, 2026 | 1.86 | — | — | — |
| Aug 4, 2026 | Jun 30, 2026 | 1.30 | 1.43 | +0.13 | +10.00% |
| May 5, 2026 | Mar 31, 2026 | 1.87 | 1.93 | +0.06 | +3.21% |
| Feb 10, 2026 | Dec 31, 2025 | 1.49 | 1.50 | +0.01 | +0.67% |
| Nov 7, 2025 | Sep 30, 2025 | 1.76 | 1.83 | +0.07 | +3.98% |
| Aug 5, 2025 | Jun 30, 2025 | 1.18 | 1.27 | +0.09 | +7.63% |
News
 Dividend Champion And Contender Highlights: Week Of September 13
 Rotating Into Value For The Remainder Of 2020
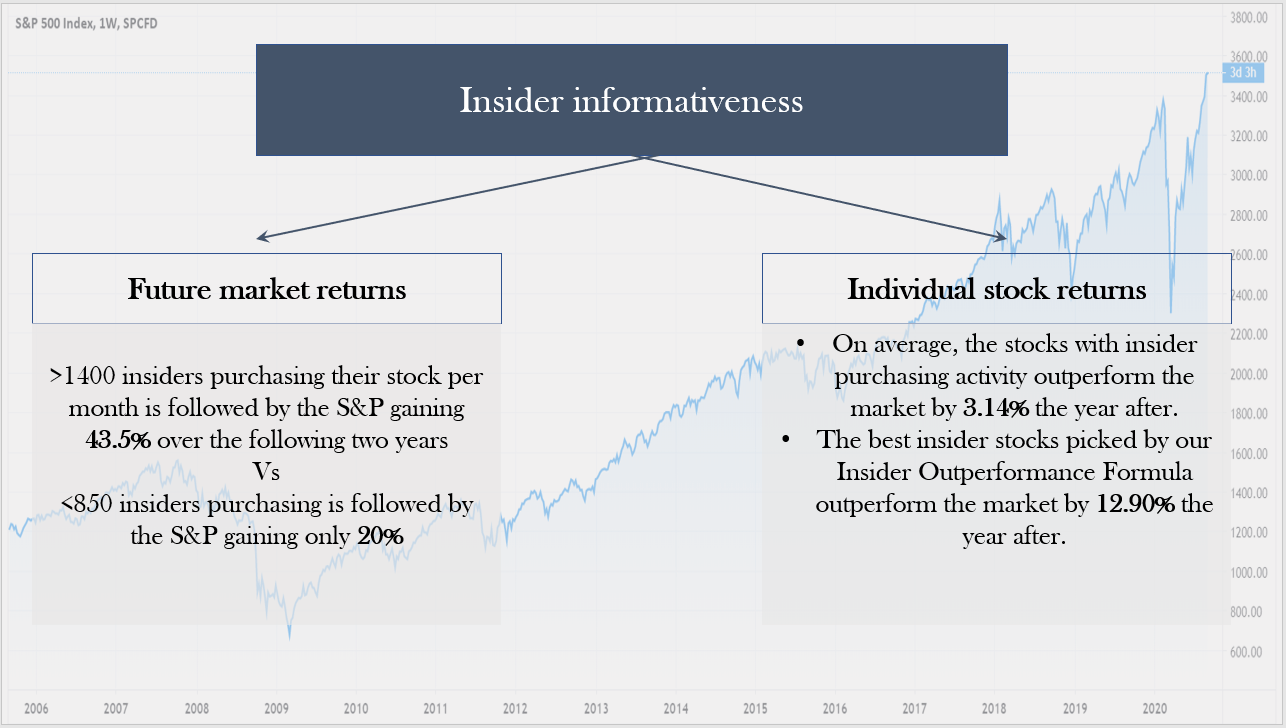 What Insiders Have To Say About This All-Time High - August 2020 Insider Update
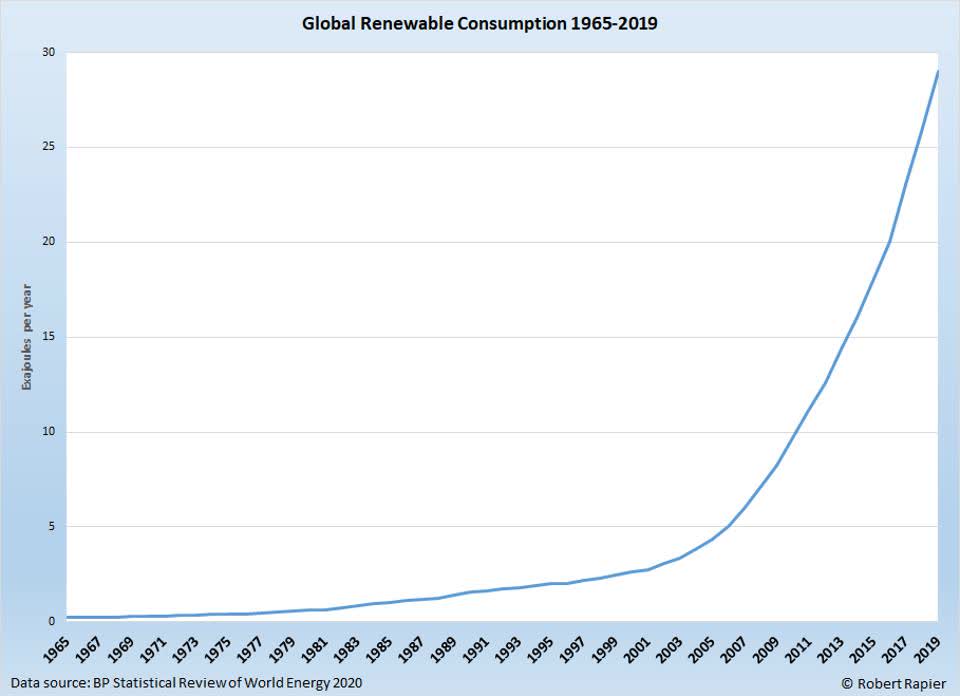 Renewable Energy Is Set For Exponential Growth In The Years Ahead
 The Retiree's Dividend Portfolio - John's July Update: The Roth IRA Shows Weakness
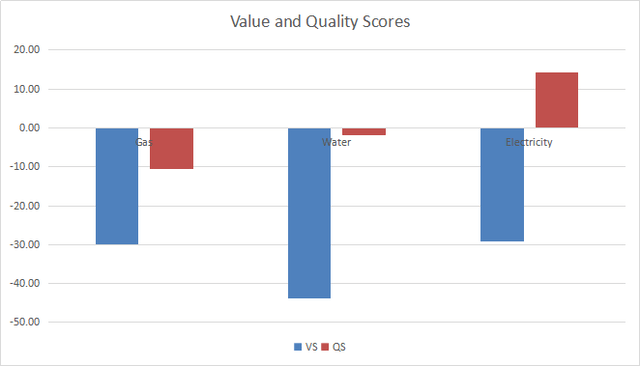 Utilities Dashboard For August
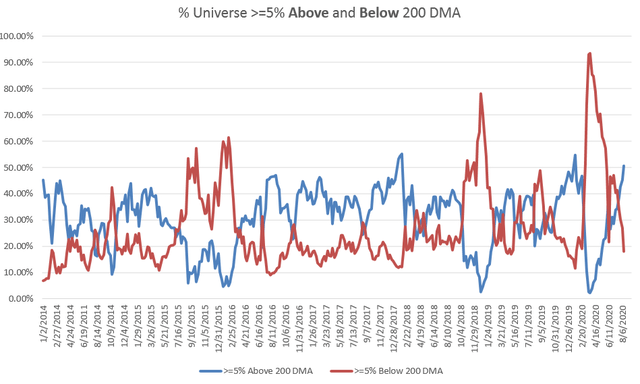 Why I'm Worrying Over A Market Drop
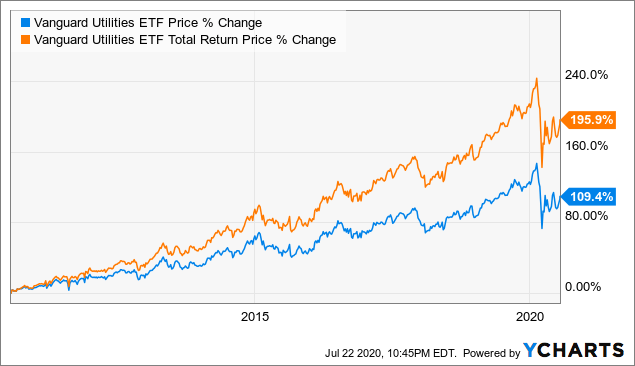 Vanguard Utilities ETF: The Current Low Rate Environment Should Support Its Higher Fund Price
 Different Perspectives On The Success Or Failure Of Dominion Energy
 The Retiree's Dividend Portfolio - John's May Update: Selling Kimco Preferred Series L For Better Opportunities
Your note
Sign in to keep a note on DUKB — it syncs with the Stock Master app.