

Cowen Inc. COWN
At closeFeb 28, 2023, 4:00 PM EST
52-week range unavailable
- Market cap
- 1.10B
- Revenue (ttm)
- 1.28B
- Profit margin
- 5.98%
- Shares out
- 28.24M
- Forward P/E
- 8.92
- Dividend
- 0.48 (1.23%)
- Ex-dividend date
- Feb 27, 2023
- Volume
- 949.37K
- Open
- 38.99
- Previous close
- 38.99
- Day's range
- 38.99 – 39.01
- Beta
- 1.41
- Analysts
- Hold
- Earnings date
- Feb 17, 2023
2Y -0.29 (-0.74%)
Key statistics
- Enterprise value
- -1.59B
- PEG ratio
- 0.97
- Price / sales
- 0.86
- Price / book
- 1.11
- Dividend yield
- 1.23%
- Payout ratio
- 21.72%
- Revenue growth
- -25.80%
- Free cash flow
- 0
- Total cash
- 5.55B
- Total debt
- 2.49B
- Return on equity
- 5.03%
- Short % of float
- 30.06%
- 50-day average
- 38.81
- 200-day average
- 35.64
Analyst view
Consensus: hold
- Strong buy0
- Buy1
- Hold1
- Sell0
- Strong sell0
Next earnings
Feb 17, 2023
Expected Feb 17, 2023. Consensus EPS estimate 0.75.
Financials — quick view
Earnings
| Report date | Quarter ending | EPS estimate | EPS reported | Surprise | Surprise % |
|---|---|---|---|---|---|
| Feb 17, 2023 | Dec 1, 2022 | 0.13 | — | — | — |
| Oct 28, 2022 | Sep 1, 2022 | 0.56 | — | — | — |
| Aug 3, 2022 | Jun 1, 2022 | 0.15 | — | — | — |
| Apr 29, 2022 | Mar 1, 2022 | 0.61 | — | — | — |
| Feb 16, 2022 | Dec 1, 2021 | 1.97 | — | — | — |
| Oct 29, 2021 | Sep 1, 2021 | 1.21 | — | — | — |
Upgrades / downgrades
| Date | Firm | Action | From | To |
|---|---|---|---|---|
| Aug 2, 2022 | Wolfe Research | down | Outperform | Peer Perform |
| Aug 2, 2022 | JMP Securities | down | Market Outperform | Market Perform |
| May 2, 2022 | Piper Sandler | main | — | Overweight |
| May 2, 2022 | JMP Securities | main | — | Market Outperform |
| Apr 12, 2022 | Goldman Sachs | main | — | Sell |
| Apr 8, 2022 | Piper Sandler | main | — | Overweight |
About Cowen Inc.
Cowen Inc., together with its subsidiaries, provides investment banking, research, sales and trading, prime brokerage, global clearing, securities financing, commission management, and investment management services in the United States and internationally. The company operates in two segments, Operating Company and Asset Company. It offers public and private capital raising, and strategic advisory services; investment products and solutions in the liquidity spectrum to institutional and private clients; and investment research services. The company also trades common stocks, listed options, equity-linked securities, and other financial instruments on behalf of institutional investor clients. In addition, it is involved in the private investment, private real estate investment, and other legacy investment activities. The company was founded in 1918 and is headquartered in New York, New York. As of March 1, 2023, Cowen Inc. operates as a subsidiary of TD Securities Inc.
- Sector
- Financial Services
- Industry
- Capital Markets
- Country
- United States
- Website
- cowen.com
News
 Premia Holdings Ltd. Completes the Acquisition of Cowen Reinsurance from TD Bank
 Synchrony to Participate in the KBW Fintech Ecosystem Conference and the TD Cowen 2026 Financials & Fintech Conference
 Chipotle Falls 5% as TD Cowen Downgrades, Cuts Target to $32; McDonald's and Yum! Brands Slip
 TD Cowen Thinks Nvidia Is Helping Oracle Get Its Data Centers Financed
 SpaceX's Next Big Business Is on the Ground, TD Cowen Says
 Helus Pharma to Participate at the TD Cowen 6th Annual Novel Mechanisms in Neuropsychiatry Summit
 Xenon to Present at TD Cowen Novel Mechanisms in Neuropsychiatry & Epilepsy Summit
 Calumet to Attend T.D. Cowen Energy Conference
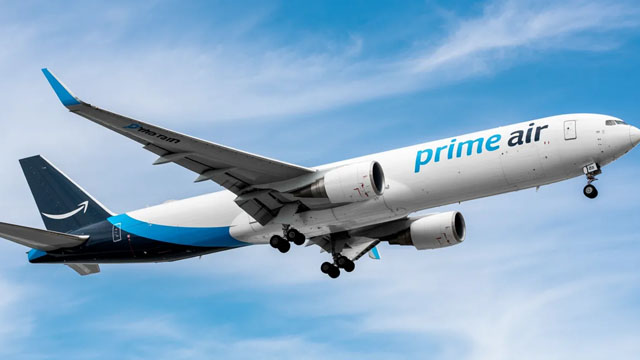 Amazon's AWS Could Compound to $222 Billion by 2027. TD Cowen Says That's 11% More Than Anyone Expects
 American Tower to Present at the TD Cowen 12th Annual Communications Infrastructure Summit
Your note
Sign in to keep a note on COWN — it syncs with the Stock Master app.
Insider holders
| Insider | Relation | Latest transaction | Date | Shares held |
|---|---|---|---|---|
| BARTH BRETT H. | Director | Stock Gift | Dec 6, 2022 | 83,178 |
| DIETZE-COURAGE KATHERINE ELIZABETH | Director | Stock Award(Grant) | Aug 29, 2022 | 85,414 |
| HOLMES JOHN J | Chief Operating Officer | Stock Award(Grant) | Feb 28, 2023 | 0 |
| KIM LORENCE H | Director | Stock Award(Grant) | Aug 29, 2022 | 38,184 |
| KOTLER STEVEN | Director | Stock Award(Grant) | Aug 29, 2022 | 72,748 |
| LASOTA STEPHEN A | Chief Financial Officer | Stock Award(Grant) | Feb 28, 2023 | 0 |
Institution ownership
| Holder | % held | Shares | Value | Reported |
|---|---|---|---|---|
| Blackrock Inc. | 8.33% | 2,334,921 | 91.04M | Dec 30, 2022 |
| Magnetar Financial LLC | 5.64% | 1,581,286 | 61.65M | Dec 30, 2022 |
| Nexpoint Asset Management, L.P. | 4.85% | 1,357,394 | 52.92M | Dec 30, 2022 |
| Vanguard Group, Inc. (The) | 4.76% | 1,332,341 | 51.95M | Dec 30, 2022 |
| Versor Investments, LP | 4.62% | 1,293,109 | 50.42M | Dec 30, 2022 |
| Tudor Investment Corporation | 4.57% | 1,280,935 | 49.94M | Dec 30, 2022 |
Fund ownership
| Holder | % held | Shares | Value | Reported |
|---|---|---|---|---|
| Highland Fds I-NexPoint Merger Arbitrage Fund | 4.49% | 1,258,396 | 49.06M | Sep 29, 2022 |
| Vanguard Total Stock Market Index Fund | 2.63% | 736,446 | 28.71M | Sep 29, 2022 |
| iShares Russell 2000 ETF | 2.18% | 611,754 | 23.85M | Dec 30, 2022 |
| Heartland Value Fund | 1.78% | 500,000 | 19.50M | Sep 29, 2022 |
| DFA U.S. Small Cap Value Series | 1.43% | 400,819 | 15.63M | Oct 30, 2022 |
| Arbitrage Fund | 1.42% | 397,161 | 15.49M | Nov 29, 2022 |