

Beyond, Inc. BYON
At closeSep 5, 2025, 4:00 PM EDT
52-week range unavailable
- YTD
- +100.41%
- 1 year
- -3.23%
- Market cap
- 222.67M
- Revenue (ttm)
- 1.48B
- Profit margin
- -22.93%
- Shares out
- 45.82M
- Forward P/E
- -2.75
- YTD return
- +100.41%
- 1-year return
- -3.23%
- Volume
- 3.09M
- Open
- 8.90
- Previous close
- 9.88
- Day's range
- 8.85 – 9.99
- Beta
- 3.71
- Analysts
- Hold
- Price target
- 12.42 (+25.7%)
Key statistics
- Enterprise value
- 129.24M
- PEG ratio
- 0.00
- Price / sales
- 0.15
- Price / book
- 1.13
- Dividend yield
- 0.00%
- Payout ratio
- 0.00%
- Revenue growth
- -16.60%
- Free cash flow
- -114.20M
- Total cash
- 140.37M
- Total debt
- 36.39M
- Return on equity
- -95.04%
- Short % of float
- 16.89%
- 50-day average
- 6.80
- 200-day average
- 14.48
Analyst view
Consensus: hold
- Target (low)
- 8.00
- Target (mean)
- 12.42
- Target (high)
- 26.00
- Strong buy2
- Buy1
- Hold6
- Sell1
- Strong sell0
Next earnings
Consensus EPS estimate -0.74957.
Financials — quick view
Earnings
| Report date | Quarter ending | EPS estimate | EPS reported | Surprise | Surprise % |
|---|---|---|---|---|---|
| Oct 24, 2024 | Sep 1, 2024 | -0.84 | -0.96 | -0.12 | -14.29% |
| Jul 29, 2024 | Jun 1, 2024 | -0.89 | -0.76 | +0.13 | +14.61% |
| May 6, 2024 | Mar 1, 2024 | -0.92 | -1.22 | -0.30 | -32.61% |
| Feb 20, 2024 | Dec 1, 2023 | -0.71 | -1.22 | -0.51 | -71.83% |
Upgrades / downgrades
| Date | Firm | Action | From | To |
|---|---|---|---|---|
| Dec 18, 2024 | Argus Research | down | Hold | Sell |
| Oct 29, 2024 | Barclays | main | Equal-Weight | Equal-Weight |
| Oct 25, 2024 | Maxim Group | main | Buy | Buy |
| Oct 25, 2024 | Wedbush | main | Outperform | Outperform |
| Oct 25, 2024 | Piper Sandler | main | Neutral | Neutral |
| Oct 25, 2024 | Needham | main | Buy | Buy |
About Beyond, Inc.
Beyond, Inc. operates as an online retailer of furniture and home furnishings products in the United States and Canada. The company offers furniture, bedding and bath, patio and outdoor gear, area rugs, tabletop and cookware, décor, storage and organization, small appliances, home improvement, and other products under the Bed Bath & Beyond brand. The company provides its products and services through its e-commerce platform accessible through its mobile application, which includes bedbathandbeyond.com, bedbathandbeyond.ca, and overstockgovernment.com. It also offers businesses advertising products or services on its website; Marketplace, a service that allows its partners to sell their products through third party sites; product sales to international customers using third party logistics providers; and Supplier Oasis, a singular integration point that enables partners to manage their products, inventory, and sales channels, as well as access multi-channel fulfillment services through its distribution network. The company was formerly known as Overstock.com, Inc. and changed its name to Beyond, Inc. in November 2023. Beyond, Inc. was founded in 1997 and is headquartered in Midvale, Utah.
- Sector
- Consumer Cyclical
- Industry
- Internet Retail
- Country
- United States
- Website
- beyond.com
News
 Bed Bath & Beyond Quarterly Loss Narrows, Expects Revenue Growth Next Year
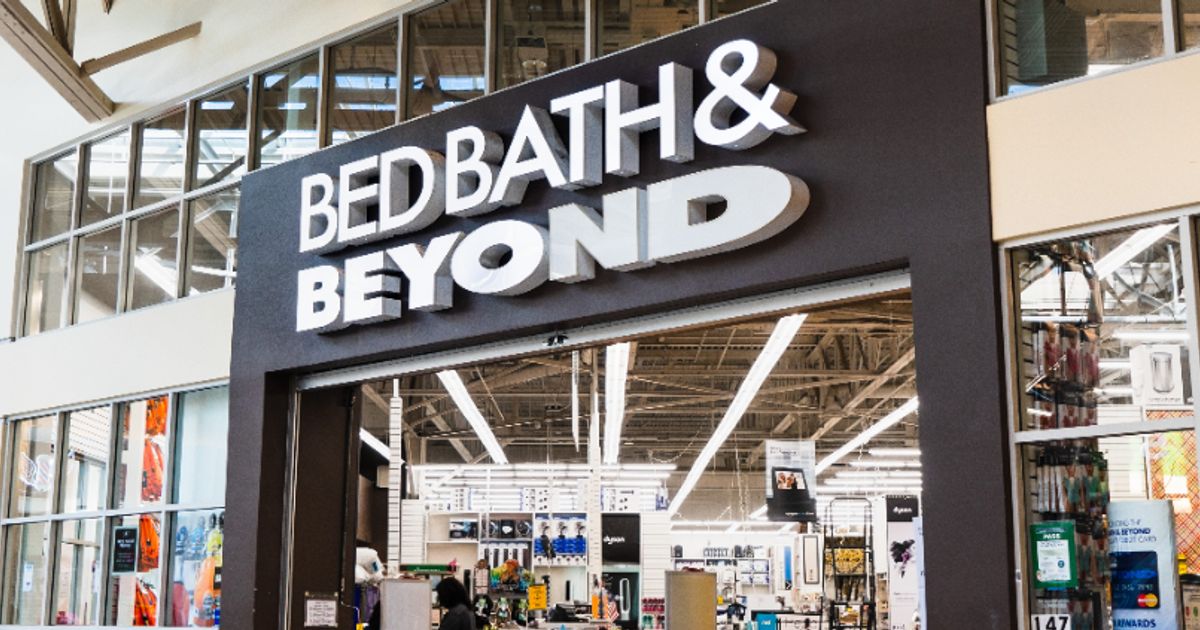 Bed Bath & Beyond poised for revenue and profit growth going into Q3 earnings: analysts
 BBBY is back: Bed Bath & Beyond stock ticker returns today as new owner aims to revive the brand
 Wall Street Analysts Think Beyond (BYON) Could Surge 59.75%: Read This Before Placing a Bet
 Bed Bath & Beyond Is Back With Plans For 300 New Stores, But None In California
 Bed Bath & Beyond says it won't open stores in California: ‘Overregulated, expensive and risky'
 Bed Bath & Beyond shuts out California, Lemonis drops bombshell
 Statement from Marcus Lemonis, Executive Chairman of Bed Bath & Beyond
 Is Beyond, Inc. (BYON) Stock Outpacing Its Retail-Wholesale Peers This Year?
 Beyond, Inc. Changes Name to Bed Bath & Beyond, Inc. and Reclaims Ticker Symbol BBBY
Your note
Sign in to keep a note on BYON — it syncs with the Stock Master app.
Insider holders
| Insider | Relation | Latest transaction | Date | Shares held |
|---|---|---|---|---|
| BURKEY JOANNA CATHERINE | Director | Sale | May 21, 2024 | 5,372 |
| CORBUS BARCLAY FLEMING | Director | Purchase | Jul 31, 2024 | 66,668 |
| LEE ADRIANNE B | Chief Financial Officer | Conversion of Exercise of derivative security | Feb 1, 2024 | 44,000 |
| LEMONIS MARCUS A | Officer and Director | Purchase | Oct 27, 2024 | 436,958 |
| NETTLES WILLIAM BENJAMIN JR | Director | Sale | Aug 13, 2024 | 11,368 |
| NICKLE ERIC GLEN | Officer | Conversion of Exercise of derivative security | Feb 1, 2024 | 27,603 |
Institution ownership
| Holder | % held | Shares | Value | Reported |
|---|---|---|---|---|
| Vanguard Group Inc | 7.45% | 3,430,477 | 16.67M | Sep 29, 2024 |
| Blackrock Inc. | 7.36% | 3,386,964 | 16.46M | Sep 29, 2024 |
| Morgan Stanley | 2.90% | 1,334,679 | 6.49M | Sep 29, 2024 |
| Marshall Wace LLP | 2.41% | 1,107,600 | 5.38M | Sep 29, 2024 |
| State Street Corporation | 2.21% | 1,016,563 | 4.94M | Sep 29, 2024 |
| Geode Capital Management, LLC | 2.17% | 998,763 | 4.85M | Sep 29, 2024 |
Fund ownership
| Holder | % held | Shares | Value | Reported |
|---|---|---|---|---|
| Vanguard Total Stock Market Index Fund | 3.14% | 1,443,893 | 7.02M | Sep 29, 2024 |
| iShares Russell 2000 ETF | 2.62% | 1,207,039 | 5.87M | Oct 30, 2024 |
| Amplify Transformational Data Sharing ETF | 2.17% | 997,349 | 4.85M | Sep 29, 2024 |
| Vanguard Small-Cap Index Fund | 1.25% | 573,892 | 2.79M | Sep 29, 2024 |
| Vanguard Extended Market Index Fund | 1.23% | 567,419 | 2.76M | Sep 29, 2024 |
| ProShares Tr-OnLine Retail ETF | 1.10% | 505,526 | 2.46M | Oct 30, 2024 |