

Vistry Group PLC BVHMF
3.50 USD 0.00 (+0.00%)
At closeNov 2, 2026, 4:00 PM EST
3.32 Day range 3.32
2.88 52-week range 10.39
- YTD
- -58.82%
- 1 year
- -59.63%
- Market cap
- 1.11B
- EPS (ttm)
- -2.12
- YTD return
- -58.82%
- 1-year return
- -59.63%
- Volume
- 1.15K
- Avg volume
- 13.47K
- Open
- 3.32
- Previous close
- 3.50
- Day's range
- 3.32 – 3.32
- 52-week range
- 2.88 – 10.39
- Earnings date
- Sep 24, 2026
1Y -4.71 (-57.37%)
Next earnings
Sep 24, 2026
Expected Sep 24, 2026. Consensus EPS estimate -0.08564.
Earnings
| Report date | Quarter ending | EPS estimate | EPS reported | Surprise | Surprise % |
|---|---|---|---|---|---|
| Sep 24, 2026 | Jun 30, 2026 | -0.08564 | — | — | — |
| Mar 4, 2026 | Dec 31, 2025 | 0.541 | 0.559 | +0.02 | +3.33% |
| Sep 10, 2025 | Jun 30, 2025 | — | 0.1288 | — | — |
| Mar 26, 2025 | Dec 31, 2024 | — | -0.14824 | — | — |
| Sep 5, 2024 | Jun 30, 2024 | — | 0.4198 | — | — |
| Mar 14, 2024 | Dec 31, 2023 | 0.712 | 0.501 | -0.21 | -29.63% |
News
 UK's Vistry appoints Severn Trent finance head Helen Miles as CFO
 Vistry Group PLC (BVHMY) Q2 2026 Earnings Call Transcript
 Vistry Group shares fall 6% as profit and cash outlook worsen
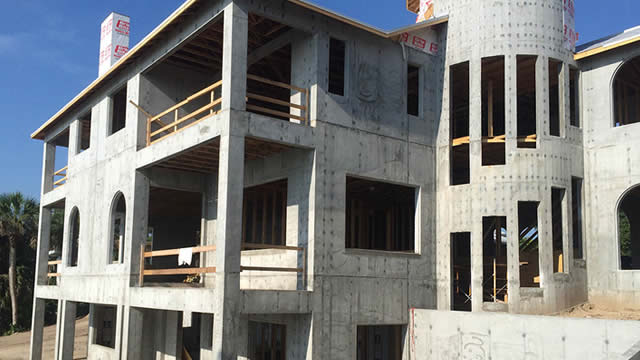 Vistry swings to £661 million loss as housebuilder unveils major restructuring
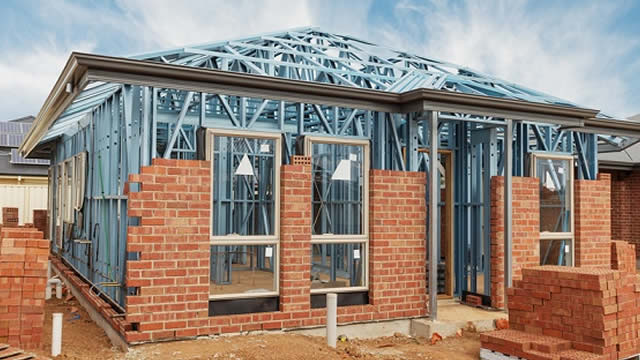 RBC keeps 'underperform' rating on Vistry ahead of strategic review
 Vistry shares jump over 14% after £350 million affordable homes grant award
 Vistry shares slide 9% amid reports credit insurer cuts supplier cover
 Vistry Plc: High Reward And High-Risk Turnaround Play
 Vistry Group Q2 Earnings Call Highlights
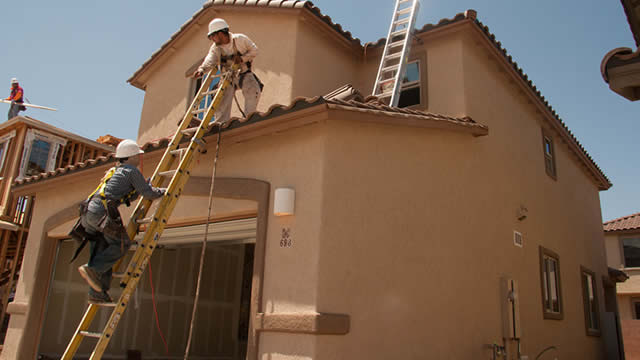 Why are Vistry, Taylor Wimpey, Barratt Redrow, Persimmon shares falling?
Your note
Sign in to keep a note on BVHMF — it syncs with the Stock Master app.