

Franklin Templeton Inc. BEN
At closeNov 4, 2026, 4:23 PM EST
After hours · Nov 4, 4:23 PM ET
- YTD
- +41.77%
- 1 year
- +49.93%
- Market cap
- 17.21B
- Revenue (ttm)
- 9.32B
- Profit margin
- 8.72%
- EPS (ttm)
- 1.54
- Shares out
- 508.08M
- P/E ratio
- 21.99
- Forward P/E
- 10.72
- Dividend
- 1.32 (4.08%)
- Ex-dividend date
- Sep 29, 2026
- YTD return
- +41.77%
- 1-year return
- +49.93%
- Volume
- 4.77M
- Avg volume
- 3.63M
- Open
- 33.00
- Previous close
- 32.36
- Day's range
- 32.63 – 33.89
- 52-week range
- 21.18 – 35.77
- Beta
- 1.60
- Analysts
- Hold
- Price target
- 35.46 (+4.7%)
- Earnings date
- Nov 6, 2026
5D +1.76 (+5.48%)
Key statistics
- Enterprise value
- 20.01B
- PEG ratio
- 0.40
- Price / sales
- 1.85
- Price / book
- 1.46
- Dividend yield
- 4.08%
- Payout ratio
- 89.12%
- Revenue growth
- 14.30%
- Free cash flow
- -2.99B
- Total cash
- 2.67B
- Total debt
- 3.57B
- Return on equity
- 7.89%
- Short % of float
- 4.64%
- 50-day average
- 32.68
- 200-day average
- 30.30
Analyst view
Consensus: hold
- Target (low)
- 26.00
- Target (mean)
- 35.46
- Target (high)
- 40.00
- Strong buy0
- Buy4
- Hold7
- Sell1
- Strong sell1
Next earnings
Nov 6, 2026
Expected Nov 6, 2026. Consensus EPS estimate 0.77102.
Financials — quick view
Earnings
| Report date | Quarter ending | EPS estimate | EPS reported | Surprise | Surprise % |
|---|---|---|---|---|---|
| Nov 6, 2026 | Sep 30, 2026 | 0.77 | — | — | — |
| Jul 31, 2026 | Jun 30, 2026 | 0.658 | 0.72 | +0.06 | +9.42% |
| Apr 28, 2026 | Mar 31, 2026 | 0.55 | 0.71 | +0.16 | +29.09% |
| Jan 30, 2026 | Dec 31, 2025 | 0.55 | 0.70 | +0.15 | +27.27% |
| Nov 7, 2025 | Sep 30, 2025 | 0.577 | 0.67 | +0.09 | +16.12% |
| Aug 1, 2025 | Jun 30, 2025 | 0.4826 | 0.49 | +0.01 | +1.53% |
Upgrades / downgrades
| Date | Firm | Action | From | To |
|---|---|---|---|---|
| Oct 14, 2026 | Barclays | main | Equal-Weight | Equal-Weight |
| Oct 12, 2026 | JP Morgan | main | Neutral | Neutral |
| Oct 12, 2026 | TD Cowen | main | Buy | Buy |
| Oct 9, 2026 | Evercore ISI Group | main | Underperform | Underperform |
| Sep 25, 2026 | Morgan Stanley | main | Equal-Weight | Equal-Weight |
| Aug 3, 2026 | Evercore ISI Group | main | Underperform | Underperform |
About Franklin Templeton Inc.
Franklin Templeton Inc. is a publicly owned asset investment manager. Through its subsidiaries, the firm provides its services to individuals, institutions, pension plans, trusts, and partnerships. It launches equity, fixed income, balanced, and multi-asset mutual funds through its subsidiaries. The firm invests in the public equity, fixed income, and alternative markets. Franklin Resources, Inc. was founded in 1947 and is based in San Mateo, California with an additional office in Calgary, Alberta; Dubai, United Arab Emirates; Edinburgh, Midlothian; Fort Lauderdale, Florida; Hyderabad, India; London, Greater London; Rancho Cordova, California; Shanghai, Shanghai Province; Singapore; Stamford, Connecticut; and Vienna.
- Sector
- Financial Services
- Industry
- Asset Management
- Country
- United States
- Website
- franklintempleton.com/corporate
News
 Franklin Templeton, Inc. Announces Preliminary Month-End Assets Under Management
 The XRP Ledger Now Ranks 6th for Tokenized Assets With $5 Billion. How Much of It Actually Needs XRP?
 Top 3 Financial Stocks That Are Preparing To Pump In November
 Uber Gears Up For Q3 Print; Here Are The Recent Forecast Changes From Wall Street's Most Accurate Analysts
 Asset Management One Co. Ltd. Sells 25,905 Shares of Franklin Resources, Inc. $BEN
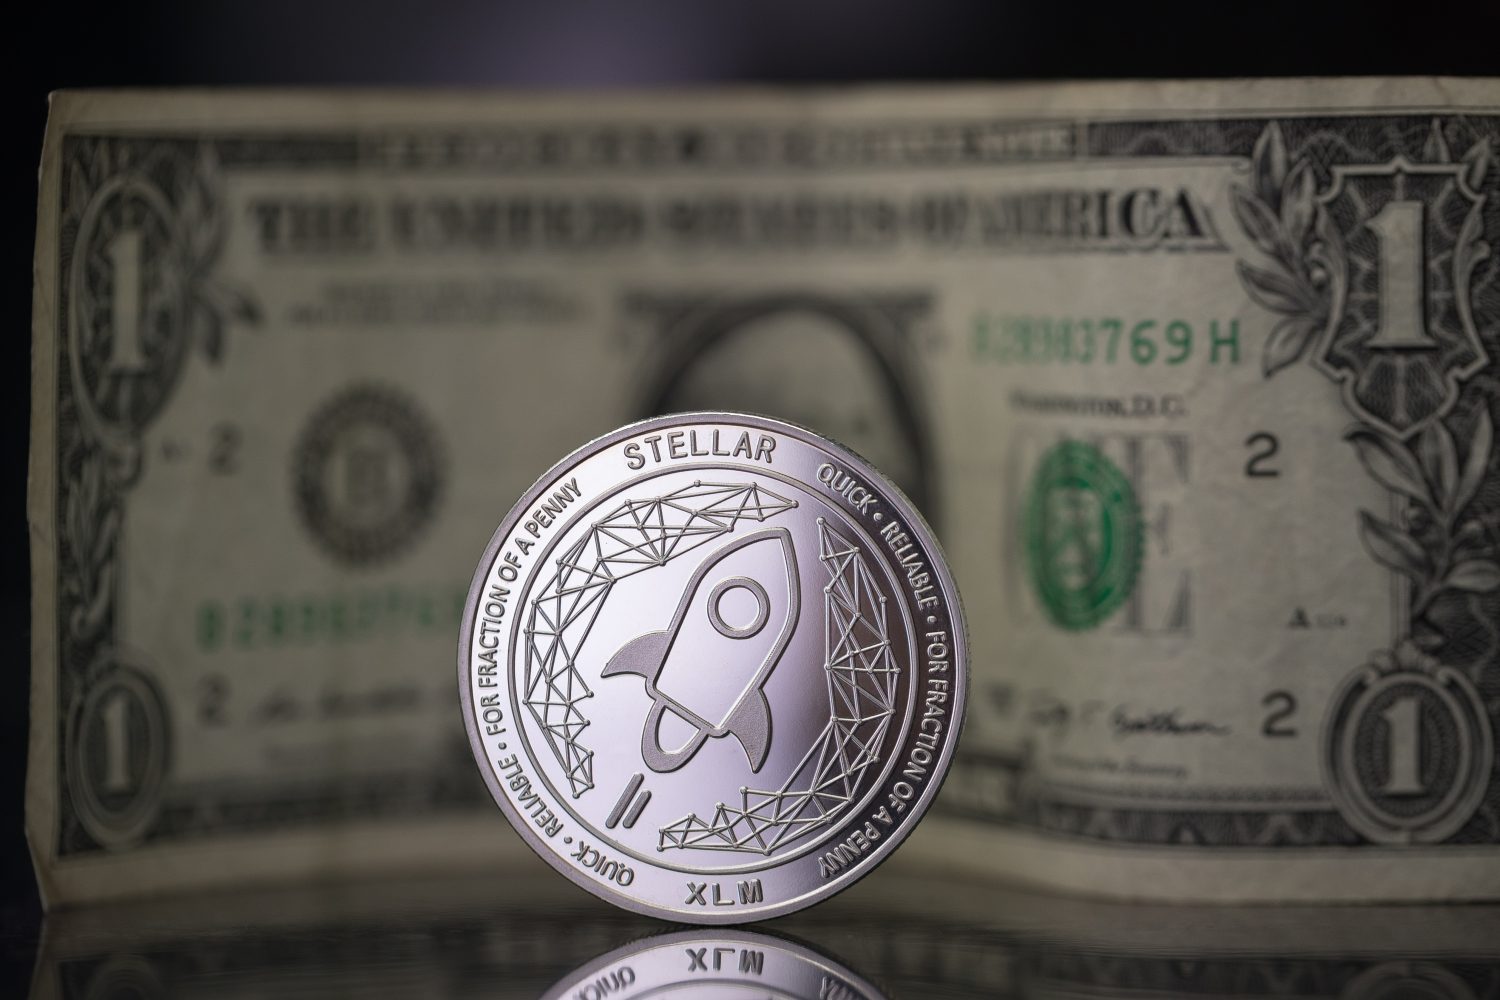 Stellar Beat Solana for New Tokenized Funds Over 90 Days. What Would XLM Be Worth if It Kept That Lead?
 Benefit Street Partners Announces Closing of a $1.1 Billion CRE CLO
 Hackers Stole a Record $9.2 Billion of Crypto This Year. Is Your Crypto Insured Anywhere?
 The First Tokenized U.S. Stock Trades on Canton on Monday. What Would Have to Happen for CC to Double?
 Uber Partners With HSBC, Franklin Templeton to Earn Extra Yield Through Blockchain Pilot
Your note
Sign in to keep a note on BEN — it syncs with the Stock Master app.
Insider holders
| Insider | Relation | Latest transaction | Date | Shares held |
|---|---|---|---|---|
| GAMBA DANIEL | President | Stock Award(Grant) | Jul 20, 2026 | 672,720 |
| JOHNSON CHARLES B | Beneficial Owner of more than 10% of a Class of Security | Stock Gift | Dec 25, 2025 | 94,193,200 |
| JOHNSON GREGORY E | Officer and Director | Stock Award(Grant) | Nov 3, 2025 | 5,950,380 |
| JOHNSON JENNIFER M | Chief Executive Officer | Stock Gift | Oct 18, 2026 | 7,249,820 |
| MERCHANT THOMAS C | General Counsel | Stock Award(Grant) | Nov 3, 2025 | 100,703 |
| MURPHY TERRENCE J | Officer | Stock Award(Grant) | Jul 20, 2026 | 416,009 |
Institution ownership
| Holder | % held | Shares | Value | Reported |
|---|---|---|---|---|
| Blackrock Inc. | 5.69% | 28,910,284 | 979.48M | Jun 29, 2026 |
| Power Corp of Canada | 4.99% | 25,340,031 | 858.52M | Jun 29, 2026 |
| Vanguard Capital Management LLC | 3.96% | 20,135,638 | 682.20M | Jun 29, 2026 |
| State Street Corporation | 3.88% | 19,733,211 | 668.56M | Jun 29, 2026 |
| Vanguard Portfolio Management LLC | 2.70% | 13,735,521 | 465.36M | Jun 29, 2026 |
| Invesco Ltd. | 2.38% | 12,091,225 | 409.65M | Jun 29, 2026 |
Fund ownership
| Holder | % held | Shares | Value | Reported |
|---|---|---|---|---|
| VANGUARD INDEX FUNDS-Vanguard Total Stock Market Index Fund | 1.95% | 9,903,891 | 335.54M | Jun 29, 2026 |
| VANGUARD INDEX FUNDS-Vanguard 500 Index Fund | 1.56% | 7,944,947 | 269.17M | Jun 29, 2026 |
| VANGUARD INDEX FUNDS-Vanguard Small-Cap Index Fund | 1.41% | 7,146,266 | 242.12M | Jun 29, 2026 |
| iShares Trust-iShares Select Dividend ETF | 1.25% | 6,333,242 | 214.57M | Sep 29, 2026 |
| Invesco Exchange-Traded Fund Trust-Invesco S&P 500 Equal Weight ETF | 1.13% | 5,733,092 | 194.24M | Sep 29, 2026 |
| ProShares Trust-ProShares S&P 500 Dividend Aristocrats ETF | 1.00% | 5,082,862 | 172.21M | Sep 29, 2026 |