

Bold Eagle Acquisition Corp. BEAG
10.59 USD 0.00 (+0.00%)
At closeNov 5, 2026, 4:23 PM EST
10.60 +0.01 +0.11%
After hours · Nov 5, 4:23 PM ET
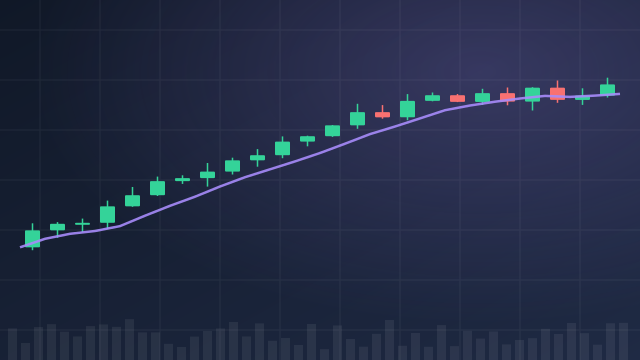
10.58 Day range 10.60
10.18 52-week range 11.11
- YTD
- +0.09%
- 1 year
- -1.40%
- Market cap
- 168.60M
- EPS (ttm)
- 0.25
- P/E ratio
- 42.36
- YTD return
- +0.09%
- 1-year return
- -1.40%
- Volume
- 78.03K
- Avg volume
- 375.53K
- Open
- 10.58
- Previous close
- 10.59
- Day's range
- 10.58 – 10.60
- 52-week range
- 10.18 – 11.11
5Y +0.73 (+7.40%)
Key statistics
- Price / sales
- 0.00
- Dividend yield
- 0.00%
- Payout ratio
- 0.00%
- Revenue growth
- 0.00%
- Free cash flow
- 0
- Total cash
- 0
- Total debt
- 0
- Return on equity
- 0.00%
- 50-day average
- 9.86
- 200-day average
- 9.86
Next earnings
Consensus EPS estimate 0.00.
Financials — quick view
BEAG Revenue — quarterly 0
BEAG Net income — quarterly 1.01M
BEAG EPS — quarterly 0.03
News
 Bold Eagle Acquisition Corp. And Merger Partner REDLattice Submit Draft Registration Statement Form S-4; Seek To Trade On Nasdaq Under Ticker Symbol 'REDL'
 REDLattice and Bold Eagle Acquisition Corp. Announce Confidential Submission of Draft Registration Statement on Form S-4 in Connection with Proposed Business Combination
 Bold Eagle Acquisition Corp. – Class A Ordinary Shares (NASDAQ:BEAG) Sees Significant Growth in Short Interest
 REDLattice To Go Public Via Bold Eagle SPAC Merger At $1.25B Pre-Money Enterprise Value, Under Ticker "REDL" Around Year-End 2026
 REDLattice, Worldwide Leading Operational Intelligence Platform for the U.S. and its Allies, to Become Public Company
 Bold Eagle Acquisition Corp. – Class A Ordinary Shares (NASDAQ:BEAG) Sees Large Decrease in Short Interest
 Stocks That Hit 52-Week Highs On Tuesday
Your note
Sign in to keep a note on BEAG — it syncs with the Stock Master app.