

Barrick Mining Corporation B
42.27 USD +1.71 (+4.22%)
At closeNov 9, 2026, 5:05 PM EST
42.45 +0.18 +0.43%
After hours · Nov 9, 5:05 PM ET
41.78 Day range 42.86
34.03 52-week range 54.69
- YTD
- -2.94%
- 1 year
- +27.74%
- Market cap
- 69.57B
- Revenue (ttm)
- 20.65B
- Profit margin
- 31.60%
- EPS (ttm)
- 3.87
- Shares out
- 1.65B
- P/E ratio
- 10.92
- Forward P/E
- 10.05
- Dividend
- 0.70 (1.73%)
- Ex-dividend date
- Aug 30, 2026
- YTD return
- -2.94%
- 1-year return
- +27.74%
- Volume
- 11.87M
- Avg volume
- 9.13M
- Open
- 42.30
- Previous close
- 40.56
- Day's range
- 41.78 – 42.86
- 52-week range
- 34.03 – 54.69
- Beta
- 1.20
- Analysts
- Buy
- Price target
- 50.11 (+18.5%)
- Earnings date
- Nov 9, 2026
5D +4.51 (+11.94%)
Key statistics
- Enterprise value
- 75.06B
- PEG ratio
- 2.04
- Price / sales
- 3.37
- Price / book
- 2.55
- Dividend yield
- 1.73%
- Payout ratio
- 23.77%
- Revenue growth
- 43.80%
- Free cash flow
- 5.09B
- Total cash
- 5.93B
- Total debt
- 4.68B
- Return on equity
- 27.01%
- Short % of float
- 0.00%
- 50-day average
- 41.32
- 200-day average
- 41.88
Analyst view
Consensus: buy
Buy
Price target (mean) 50.11 +18.5% upside
Now 42.27
- Target (low)
- 29.00
- Target (mean)
- 50.11
- Target (high)
- 58.50
Ratings (0m) 24 17 buy · 6 hold · 1 sell
- Strong buy8
- Buy9
- Hold6
- Sell0
- Strong sell1
Next earnings
Nov 9, 2026
Expected Nov 9, 2026. Consensus EPS estimate 0.85594.
Financials — quick view
B Revenue — quarterly 5.29B
B Net income — quarterly 1.22B
B EPS — quarterly 0.73
Earnings
| Report date | Quarter ending | EPS estimate | EPS reported | Surprise | Surprise % |
|---|---|---|---|---|---|
| Nov 9, 2026 | Sep 30, 2026 | 0.78 | — | — | — |
| Aug 10, 2026 | Jun 30, 2026 | 0.81 | 0.82 | +0.01 | +1.23% |
| May 11, 2026 | Mar 31, 2026 | 0.74 | 0.98 | +0.24 | +32.43% |
| Feb 5, 2026 | Dec 31, 2025 | 0.85 | 1.04 | +0.19 | +22.35% |
| Nov 10, 2025 | Sep 30, 2025 | 0.57 | 0.58 | +0.01 | +1.75% |
| Aug 11, 2025 | Jun 30, 2025 | 0.47 | 0.47 | 0.00 | 0.00% |
Upgrades / downgrades
| Date | Firm | Action | From | To |
|---|---|---|---|---|
| Oct 22, 2026 | Freedom Broker | down | Buy | Hold |
| Oct 21, 2026 | JP Morgan | main | Overweight | Overweight |
| Oct 16, 2026 | CIBC | down | Outperformer | Neutral |
| Sep 16, 2026 | RBC Capital | main | Outperform | Outperform |
| Sep 9, 2026 | Bernstein | main | Outperform | Outperform |
| Aug 14, 2026 | JP Morgan | main | Overweight | Overweight |
About Barrick Mining Corporation
Barrick Mining Corporation engages in the exploration, development, production, and sale of mineral properties. It explores for gold, copper, silver, and energy materials. The company was formerly known as Barrick Gold Corporation and changed its name to Barrick Mining Corporation in May 2025. Barrick Mining Corporation was founded in 1983 and is based in Toronto, Canada.
- Sector
- Basic Materials
- Industry
- Gold
- Country
- Canada
- Website
- barrick.com
News
 Barrick Mining Q3 2026 Earnings Call Transcript
 Barrick Misses Q3 Estimates but Holds Gold Output Guidance; Shares Rise
 Barrick Mining Q3 Adj. EPS $0.82 Misses $0.85 Estimate, Sales $5.073B Miss $5.302B Estimate
 Nebius Could Swing $6.56 Billion After Earnings
 Barrick Reports Third Quarter 2026 Results
 Barrick Declares Q3 Dividend
 KKR, Constellation Energy On Deck Monday As Private Credit, Power Face Test
 Here’s How Much You Would Have Made Owning Barrick Mining Stock In The Last 5 Years
 If You Invested $1000 In Barrick Mining Stock 5 Years Ago, You Would Have This Much Today
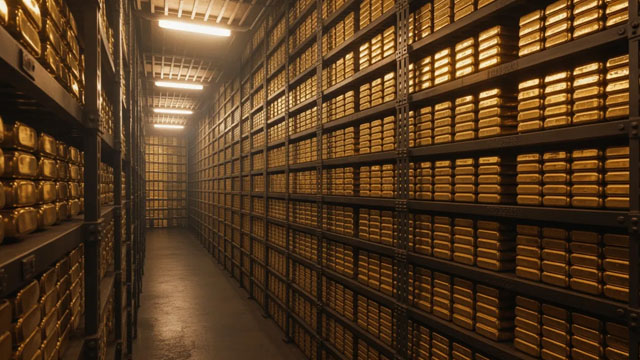 Barrick Mining to Post Q3 Earnings: What's in the Offing for the Stock?
Your note
Sign in to keep a note on B — it syncs with the Stock Master app.
Institution ownership
| Holder | % held | Shares | Value | Reported |
|---|---|---|---|---|
| Capital International Investors | 4.02% | 65,544,397 | 2.77B | Jun 29, 2026 |
| Van Eck Associates Corporation | 3.69% | 60,032,632 | 2.54B | Jun 29, 2026 |
| Blackrock Inc. | 3.07% | 50,020,560 | 2.11B | Jun 29, 2026 |
| Vanguard Capital Management LLC | 2.83% | 46,130,882 | 1.95B | Jun 29, 2026 |
| Royal Bank of Canada | 2.51% | 40,822,919 | 1.73B | Jun 29, 2026 |
| Bank of Montreal /CAN/ | 2.20% | 35,751,217 | 1.51B | Jun 29, 2026 |
Fund ownership
| Holder | % held | Shares | Value | Reported |
|---|---|---|---|---|
| VanEck ETF Trust-VanEck Gold Miners ETF | 3.14% | 51,127,666 | 2.16B | Sep 29, 2026 |
| VANGUARD STAR FUNDS-Vanguard Total International Stock Index Fund | 1.51% | 24,566,393 | 1.04B | Jul 30, 2026 |
| AMERICAN FUNDS INSURANCE SERIES-Eupac Fund | 1.37% | 22,361,930 | 945.13M | Sep 29, 2026 |
| Income Fund of America | 1.01% | 16,415,500 | 693.80M | Sep 29, 2026 |
| VANGUARD TAX-MANAGED FUNDS-Vanguard Developed Markets Index Fund | 1.00% | 16,309,462 | 689.32M | Jun 29, 2026 |
| Growth Fund of America | 0.71% | 11,487,153 | 485.50M | Sep 29, 2026 |