

Amyris, Inc. AMRS
0.05 0.00 (+0.00%)
At closeJan 16, 2025, 4:00 PM EST
0.05 Day range 0.0643
52-week range unavailable
- Volume
- 46.75M
- Open
- 0.064
- Previous close
- 0.05
- Day's range
- 0.05 – 0.0643
- Analysts
- Hold
- Earnings date
- Aug 22, 2023
2Y -14.3858 (-99.69%)
Key statistics
- Price / sales
- 0.00
- Dividend yield
- 0.00%
- Payout ratio
- 0.00%
- Revenue growth
- 0.00%
- Free cash flow
- 0
- Total cash
- 0
- Total debt
- 0
- Return on equity
- 0.00%
- 50-day average
- 0.00
- 200-day average
- 0.00
Analyst view
Consensus: hold
Hold
Price target (mean) —
Ratings (0m) 2 1 buy · 1 hold · 0 sell
- Strong buy0
- Buy1
- Hold1
- Sell0
- Strong sell0
Next earnings
Aug 22, 2023
Expected Aug 22, 2023. Consensus EPS estimate 0.00.
Financials — quick view
AMRS Revenue — quarterly 56.08M
AMRS Net income — quarterly -193.34M
AMRS EPS — quarterly -0.53
Earnings
| Report date | Quarter ending | EPS estimate | EPS reported | Surprise | Surprise % |
|---|---|---|---|---|---|
| Aug 22, 2023 | Jun 1, 2023 | 0.23 | — | — | — |
| May 9, 2023 | Mar 1, 2023 | -0.34 | — | — | — |
| Mar 15, 2023 | Dec 1, 2022 | -0.20 | — | — | — |
| Nov 8, 2022 | Sep 1, 2022 | -0.21 | — | — | — |
| Aug 9, 2022 | Jun 1, 2022 | -0.28 | — | — | — |
| May 10, 2022 | Mar 1, 2022 | -0.24 | — | — | — |
News
 Amyris and Ingredion Wind Down RealSweet Joint Venture
 Amyris Takes Full Ownership of Brazilian Industrial Fermentation Plant and Invests in Completion of Fourth Precision Fermentation Line
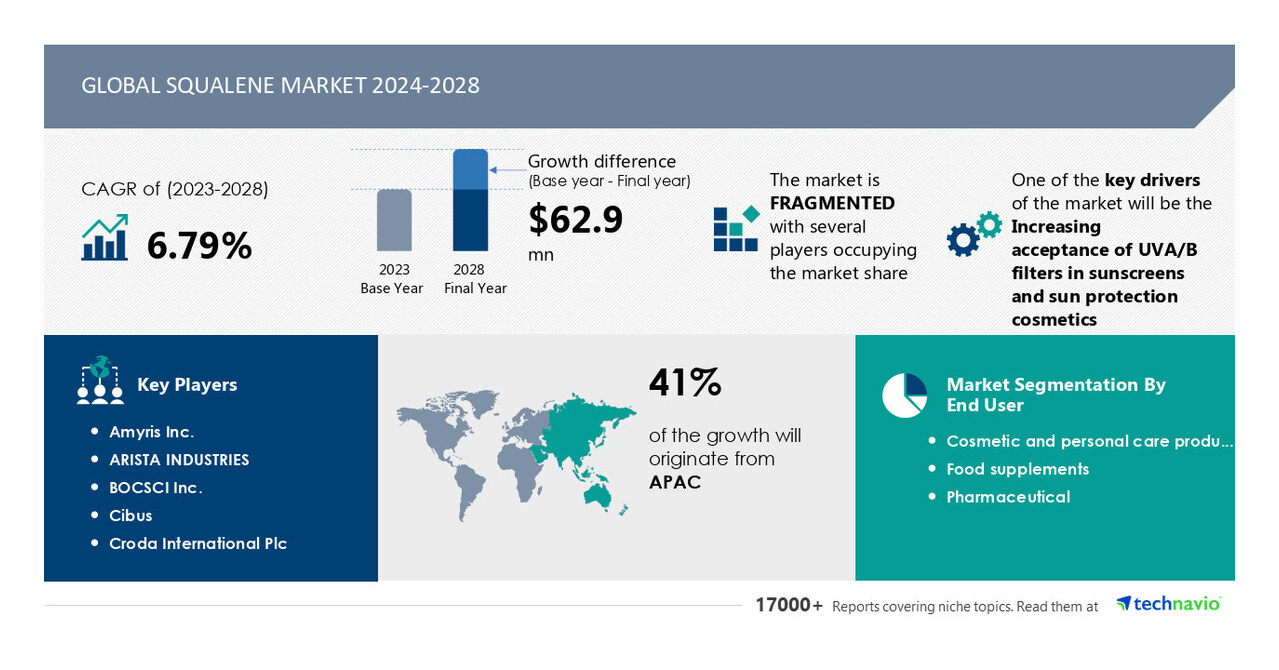 Squalene Market to Grow by USD 62.9 Million from 2024-2028, Driven by Rising Adoption of UVA/UVB Filters in Sunscreens, Report Powered by AI - Technavio
 Why Maxeon Solar Technologies Are Trading Lower By Around 32%? Here Are Other Stocks Moving In Friday's Mid-Day Session
 Dow Surges 100 Points; US Consumer Sentiment Tops Expectations
 Retail investors flock to penny stocks WeWork, Amyris, Proterra
 AMRS Stock Surges 152% as Amyris Files for Bankruptcy
 Nasdaq Down 100 Points; Wholesale Prices Rise More Than Expected
- Why Krispy Kreme Shares Are Trading Lower By Around 10%? Here Are Other Stocks Moving In Thursday's Mid-Day Session
 Biotech Company Amyris Files for Bankruptcy
Your note
Sign in to keep a note on AMRS — it syncs with the Stock Master app.