

Advanced Micro Devices, Inc. AMD
At closeNov 10, 2026, 4:18 AM EST
Pre-market · Nov 10, 4:18 AM ET
- YTD
- +137.48%
- 1 year
- +117.77%
Discussion (7884)
Sign in to join the discussion
 Tim K AMD 1 year ago #1921
$AMD ?From Banana3. Listen and learn:
Is AMD set to surge in 2025? ?
AMD - weekly chart analysis ?
My target for this chart is ?152 ?
This is the same weekly pattern that just occurred for $NVDA before it ran to $152… The Declining Inverse Head and Shoulders Pattern
I’ve been doing this charts for years. In 2019 I saw these exact same things happen that’s why I’m here to report to you. What happened first was NVDA put in a WEEKLY Inverse head and shoulders and so did $AMD after with a lag, I remember everyone being frustrated with AMD just before it had a monsterous run ?
History doesn’t always repeat itself but it often rhymes
All of this consolidation is occurring at the 150SMA and 200SMA on the weekly which is a very strong area for support, those that have been following along for a while know that one of the little hidden secrets u should bookmark is tech stocks do care A LOT about the 150SMA especially on daily and weekly time frames ?
So in this case it tightened up consolidation in between the 150SMA and 200SMA while setting up the same pattern I noticed from years ago with the same cadence or “dance steps” as the last time around where NVDA set up the same pattern and then AMD followed with a lag is all the kind of movie plot ? ? I look for ?
Indicators are well reset and starting to show signs of bottoming out and ready to turn up, when and if that happens that will be a huge signal and powerful tailwind as it took a long time to form
First stop and often is after a 200SMA weekly test is you go back to the 50SMA weekly which sits around 154, I highlighted it in a blue box on the top left corner of the chart
The measured move of this pattern is all the way to ?$220 ??
Not financial advice!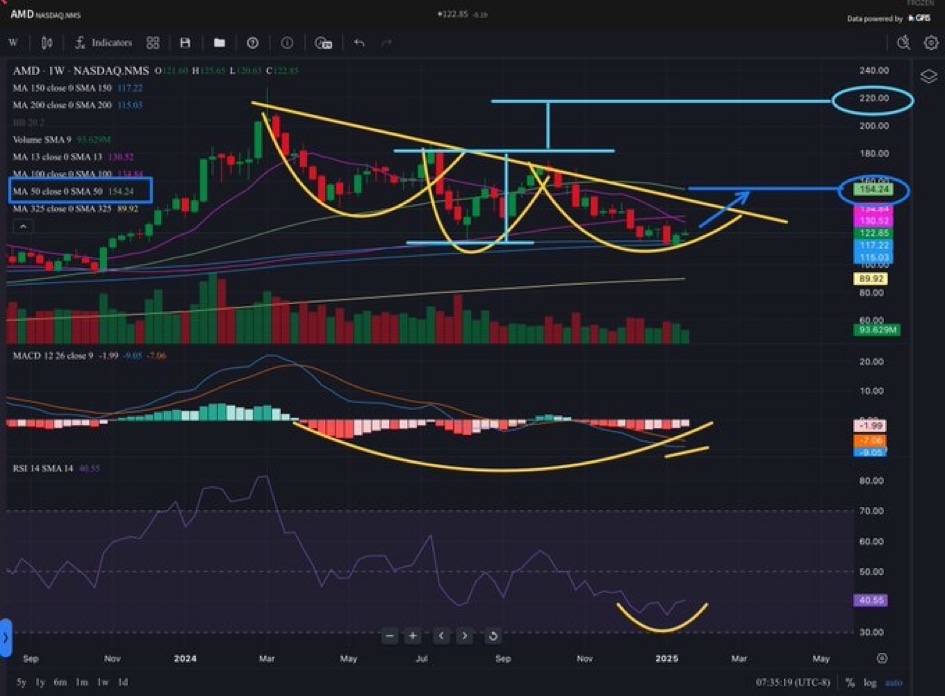
Tim K AMD 1 year ago #1922Lisa needs to go! Now!!
Someone already knows that they will miss the earnings … $AMD
Lisa Su must be fired. Now!!!
 GameFancier (GameFancier) AMD 1 year ago #1926
Lisa Su must be fired now!!!
Obviously what I wrote before is coming true. This stock is shit and Lisa Su should be fired. In February it will be carnage
As of today I am out of $AMD. I'm happy because this shit will miss earnings