

Whole Foods Market, Inc. WFM
41.99 0.00 (+0.00%)
At closeJun 28, 2019, 6:07 PM EDT
41.99 Day range 42.00
27.86 52-week range 43.84
- Market cap
- 13.45B
- EPS (ttm)
- 2.83
- P/E ratio
- 33.43
- Forward P/E
- 29.78
- Volume
- 4.27M
- Avg volume
- 6.51M
- Open
- 41.99
- Previous close
- 41.99
- Day's range
- 41.99 – 42.00
- 52-week range
- 27.86 – 43.84
- Analysts
- Hold
- Price target
- 39.75 (-5.3%)
No chart data for this range yet.
Key statistics
- Enterprise value
- 0
- PEG ratio
- 0.00
- Price / sales
- 0.00
- Price / book
- 0.00
- Dividend yield
- 0.00%
- Payout ratio
- 0.00%
- Revenue growth
- 0.00%
- Free cash flow
- 0
- Total cash
- 0
- Total debt
- 0
- Return on equity
- 0.00%
- Short % of float
- 0.00%
- 50-day average
- 41.82
- 200-day average
- 37.02
Financials — quick view
WFM Revenue — quarterly 3.73B
WFM Net income — quarterly 106.00M
WFM EPS — quarterly 0.33
Earnings
| Report date | Quarter ending | EPS estimate | EPS reported | Surprise | Surprise % |
|---|---|---|---|---|---|
| May 19, 2017 | Apr 9, 2017 | — | 0.61 | — | — |
| Apr 8, 2017 | Sep 24, 2017 | — | 1.59 | — | — |
| Jan 14, 2017 | Jul 2, 2017 | — | 0.33 | — | — |
| Sep 24, 2016 | Jan 15, 2017 | — | 0.30 | — | — |
| May 13, 2016 | Apr 10, 2016 | — | 0.90 | — | — |
| Apr 9, 2016 | Sep 25, 2016 | — | 0.27 | — | — |
Upgrades / downgrades
| Date | Firm | Action | From | To |
|---|---|---|---|---|
| Aug 23, 2017 | Barclays | down | Overweight | Equal-Weight |
| Aug 6, 2017 | Tigress Financial | down | Buy | Neutral |
| Jul 10, 2017 | Wells Fargo | down | — | Market Perform |
| Jul 9, 2017 | UBS | up | — | Neutral |
| Jun 28, 2017 | Oppenheimer | down | — | Market Perform |
| Jun 18, 2017 | BMO Capital | up | — | Market Perform |
News
 8x8 Extends AI Across the Entire Organization, Bringing Enterprise-Grade Intelligence and Automation to Every Team
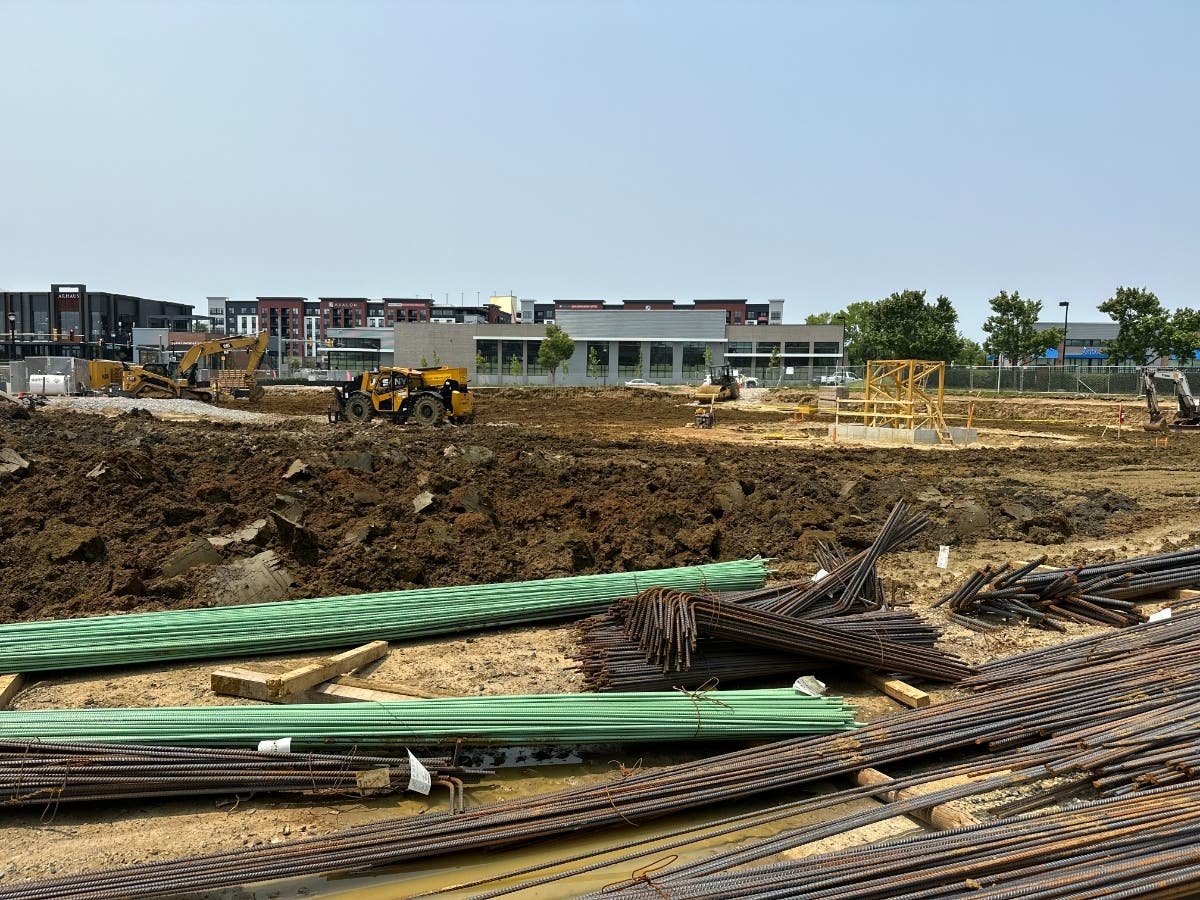 Apartments Under Construction At Annapolis Town Center
 2025 Grocery Store Closings Driven By These Factors
 18 Biggest Mid-Day Gainers For Friday
 22 Stocks Moving In Friday's Pre-Market Session
- Speculating Grocer Consolidation Amid Amazon–Whole Foods Deal
 The Pain For Grocery Stocks May Have Just Began Thanks To Amazon
 How Whole Foods Went From Undervalued To Overvalued
- 12 Stocks To Watch For May 10, 2017
- Earnings Scheduled For May 10, 2017
Your note
Sign in to keep a note on WFM — it syncs with the Stock Master app.
Insider holders
| Insider | Relation | Latest transaction | Date | Shares held |
|---|---|---|---|---|
| ALLSHOUSE SCOTT A | Officer | Disposition (Non Open Market) | Aug 27, 2017 | 0 |
| BASHAW MICHAEL | Officer | Disposition (Non Open Market) | Aug 27, 2017 | 0 |
| BRADLEY PATRICK E | Officer | Disposition (Non Open Market) | Aug 27, 2017 | 0 |
| BUECHEL JASON | Officer | Disposition (Non Open Market) | Aug 27, 2017 | 0 |
| COE MARY ELLEN | Director | Disposition (Non Open Market) | Aug 27, 2017 | 0 |
| DERBA LAURA A | Officer | Disposition (Non Open Market) | Aug 27, 2017 | 0 |
Institution ownership
| Holder | % held | Shares | Value | Reported |
|---|---|---|---|---|
| Vanguard Group, Inc. (The) | 9.91% | 31,681,238 | 1.35B | Jun 29, 2017 |
| Jana Partners LLC | 7.28% | 23,274,830 | 990.58M | Jun 29, 2017 |
| Blackrock Inc. | 6.30% | 20,118,134 | 856.23M | Jun 29, 2017 |
| State Street Corporation | 4.42% | 14,111,128 | 600.57M | Jun 29, 2017 |
| Sands Capital Management, Inc. | 3.66% | 11,695,989 | 497.78M | Jun 29, 2017 |
| Goldman Sachs Group, Inc. | 1.89% | 6,032,839 | 256.76M | Jun 29, 2017 |
Fund ownership
| Holder | % held | Shares | Value | Reported |
|---|---|---|---|---|
| Vanguard Mid-Cap Index Fund | 2.40% | 7,660,184 | 219.08M | Mar 30, 2017 |
| Vanguard Total Stock Market Index Fund | 2.22% | 7,081,862 | 202.54M | Mar 30, 2017 |
| Parnassus Endeavor Fund | 1.72% | 5,500,000 | 157.30M | Mar 30, 2017 |
| Amcap Fund | 1.53% | 4,898,000 | 140.08M | Mar 30, 2017 |
| Vanguard 500 Index Fund | 1.52% | 4,858,681 | 138.96M | Mar 30, 2017 |
| SPDR S&P 500 ETF Trust | 1.14% | 3,645,747 | 127.13M | May 30, 2017 |