

The Wendy's Company WEN
Nov 11, 2026, 11:42 AM EST
- YTD
- -1.50%
- 1 year
- -7.29%
- Market cap
- 1.57B
- Revenue (ttm)
- 2.20B
- Profit margin
- 4.40%
- EPS (ttm)
- 0.51
- Shares out
- 191.24M
- P/E ratio
- 16.08
- Forward P/E
- 16.39
- Dividend
- 0.28 (3.66%)
- Ex-dividend date
- Nov 30, 2026
- YTD return
- -1.50%
- 1-year return
- -7.29%
- Volume
- 1.64M
- Avg volume
- 7.57M
- Open
- 8.27
- Previous close
- 8.34
- Day's range
- 8.17 – 8.35
- 52-week range
- 5.94 – 9.45
- Beta
- 0.37
- Analysts
- Hold
- Price target
- 8.04 (-2.1%)
- Earnings date
- Feb 12, 2027
5D +0.52 (+6.70%)
Key statistics
- Enterprise value
- 5.27B
- PEG ratio
- 1.51
- Price / sales
- 0.72
- Price / book
- 12.81
- Dividend yield
- 3.37%
- Payout ratio
- 96.08%
- Revenue growth
- -0.50%
- Free cash flow
- 191.33M
- Total cash
- 373.70M
- Total debt
- 4.05B
- Return on equity
- 82.95%
- Short % of float
- 38.26%
- 50-day average
- 6.95
- 200-day average
- 7.34
Analyst view
Consensus: hold
- Target (low)
- 5.00
- Target (mean)
- 8.04
- Target (high)
- 11.00
- Strong buy0
- Buy2
- Hold15
- Sell3
- Strong sell0
Next earnings
Feb 12, 2027
Expected Feb 12, 2027. Consensus EPS estimate 0.09366.
Financials — quick view
Earnings
| Report date | Quarter ending | EPS estimate | EPS reported | Surprise | Surprise % |
|---|---|---|---|---|---|
| Feb 12, 2027 | Dec 27, 2026 | 0.10 | — | — | — |
| Nov 5, 2026 | Sep 27, 2026 | 0.09233 | 0.13 | +0.04 | +40.80% |
| Aug 7, 2026 | Jun 28, 2026 | 0.1629 | 0.18 | +0.02 | +10.50% |
| May 8, 2026 | Mar 29, 2026 | 0.10 | 0.12 | +0.02 | +20.00% |
| Feb 13, 2026 | Dec 28, 2025 | 0.14 | 0.16 | +0.02 | +14.29% |
| Nov 7, 2025 | Sep 28, 2025 | 0.1952 | 0.24 | +0.04 | +22.95% |
Upgrades / downgrades
| Date | Firm | Action | From | To |
|---|---|---|---|---|
| Nov 9, 2026 | RBC Capital | main | Sector Perform | Sector Perform |
| Nov 6, 2026 | Citigroup | main | Neutral | Neutral |
| Nov 6, 2026 | Stephens & Co. | main | Equal-Weight | Equal-Weight |
| Oct 29, 2026 | Argus Research | down | Buy | Sell |
| Oct 28, 2026 | TD Cowen | reit | Hold | Hold |
| Oct 26, 2026 | UBS | main | Neutral | Neutral |
About The Wendy's Company
The Wendy's Company, together with its subsidiaries, engages in the operation, development, and franchising of a system of quick-service restaurants in the United States and internationally. The company operates through the Wendy's U.S., Wendy's International, and Global Real Estate & Development segments. Its restaurants offer a menu that includes hamburger sandwiches and chicken sandwiches; chicken tenders and nuggets, chili, french fries, baked potatoes, salads, soft drinks, Frosty desserts, and kids' meals; breakfast menu, including the Breakfast Baconator sandwich and seasoned products; and a variety of promotional products on a limited time basis. The company also owns and leases real estate properties. As of December 28, 2025, there were 5,969 Wendy's restaurants in operation in the United States and 1,428 Wendy's restaurants in operation in 38 foreign countries and U.S. territories. The company was formerly known as Wendy's/Arby's Group, Inc. and changed its name to The Wendy's Company in July 2011. The Wendy's Company was founded in 1969 and is headquartered in Dublin, Ohio.
- Sector
- Consumer Cyclical
- Industry
- Restaurants
- Country
- United States
- Website
- wendys.com
News
 Wendy's: 3 Key Takeaways for Long-Term Investors
 RBC Capital Maintains Sector Perform on Wendy's, Raises Price Target to $8
- Citigroup Maintains Neutral on Wendy's, Raises Price Target to $8
 Texas Roadhouse To Rally Around 11%? Here Are 10 Top Analyst Forecasts For Friday
 Wendy's: Significant Turnaround Potential Remains Mispriced
 What Wendy's (WEN) Said on Its Q3 Earnings Call
 Stephens & Co. Maintains Equal-Weight on Wendy's, Raises Price Target to $8
 The Wendy's Company (WEN) Q3 2026 Earnings Call Transcript
 Wendy's Rejects Buyout Offer, Insists Its Best Days Are Still Ahead
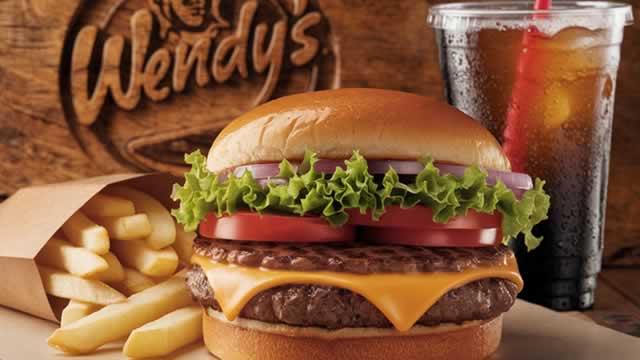 Wendy's Board Blocks Peltz's Buyout with Poison Pill
Your note
Sign in to keep a note on WEN — it syncs with the Stock Master app.
Insider holders
| Insider | Relation | Latest transaction | Date | Shares held |
|---|---|---|---|---|
| ESPOSITO LILIANA | Officer | Conversion of Exercise of derivative security | Aug 11, 2026 | 122,257 |
| MATHEWS-SPRADLIN MICH J | Director | Stock Award(Grant) | May 19, 2026 | 98,740 |
| MAY PETER W | Director and Beneficial Owner of more than 10% of a Class of Security | Stock Award(Grant) | Jun 28, 2026 | 20,510,700 |
| O BRIEN MATTHEW COLEY | Officer | Conversion of Exercise of derivative security | Feb 26, 2026 | 106,587 |
| PELTZ BRADLEY G. | Director | Stock Award(Grant) | Jun 28, 2026 | 181,351 |
| PELTZ MATTHEW H | Director and Beneficial Owner of more than 10% of a Class of Security | Stock Award(Grant) | Jun 30, 2025 | 15,208,000 |
Institution ownership
| Holder | % held | Shares | Value | Reported |
|---|---|---|---|---|
| Trian Fund Management, LP | 15.93% | 30,468,434 | 254.11M | Jun 29, 2026 |
| Blackrock Inc. | 13.76% | 26,314,724 | 219.46M | Jun 29, 2026 |
| Vanguard Portfolio Management LLC | 5.39% | 10,301,732 | 85.92M | Jun 29, 2026 |
| Fairfax Financial Holdings Ltd | 4.19% | 8,005,627 | 66.77M | Jun 29, 2026 |
| Charles Schwab Investment Management, Inc. | 3.93% | 7,523,646 | 62.75M | Jun 29, 2026 |
| Vanguard Capital Management LLC | 3.62% | 6,924,310 | 57.75M | Jun 29, 2026 |
Fund ownership
| Holder | % held | Shares | Value | Reported |
|---|---|---|---|---|
| iShares Trust-iShares Core S&P Small-Cap ETF | 4.98% | 9,530,545 | 79.48M | Sep 29, 2026 |
| VANGUARD INDEX FUNDS-Vanguard Total Stock Market Index Fund | 2.54% | 4,851,270 | 40.46M | Jun 29, 2026 |
| SCHWAB STRATEGIC TRUST-Schwab US Dividend Equity ETF | 2.25% | 4,299,633 | 35.86M | Aug 30, 2026 |
| iShares Trust-iShares Russell 2000 ETF | 2.20% | 4,203,854 | 35.06M | Sep 29, 2026 |
| VANGUARD INDEX FUNDS-Vanguard Small-Cap Index Fund | 1.83% | 3,491,260 | 29.12M | Jun 29, 2026 |
| HARRIS ASSOCIATES INVESTMENT TRUST-Oakmark Equity and Income Fund | 1.78% | 3,397,400 | 28.33M | Jun 29, 2026 |