

U.S. Well Services, Inc. USWS
7.41 0.00 (+0.00%)
At closeOct 31, 2022, 4:00 PM EDT
7.15 Day range 7.58
52-week range unavailable
- Market cap
- 95.05M
- Revenue (ttm)
- 205.32M
- Profit margin
- -32.83%
- Shares out
- 12.83M
- Forward P/E
- -15.77
- Volume
- 141.59K
- Open
- 7.15
- Previous close
- 7.41
- Day's range
- 7.15 – 7.58
- Beta
- 1.12
- Analysts
- Hold
- Price target
- 7.80 (+5.3%)
- Earnings date
- Nov 11, 2022
2Y -7.35 (-49.80%)
Key statistics
- Enterprise value
- 420.12M
- PEG ratio
- 0.00
- Price / sales
- 0.46
- Price / book
- 0.00
- Dividend yield
- 0.00%
- Payout ratio
- 0.00%
- Revenue growth
- -12.70%
- Free cash flow
- -36.44M
- Total cash
- 17.27M
- Total debt
- 314.63M
- Return on equity
- 0.00%
- Short % of float
- 11.49%
- 50-day average
- 6.25
- 200-day average
- 5.81
Analyst view
Consensus: hold
Hold
Price target (mean) 7.80
Ratings (-1m) 2 0 buy · 2 hold · 0 sell
- Strong buy0
- Buy0
- Hold2
- Sell0
- Strong sell0
Next earnings
Nov 11, 2022
Expected Nov 11, 2022. Consensus EPS estimate -0.70.
Financials — quick view
USWS Revenue — quarterly 68.76M
USWS Net income — quarterly -9.34M
USWS EPS — quarterly -0.82
Earnings
| Report date | Quarter ending | EPS estimate | EPS reported | Surprise | Surprise % |
|---|---|---|---|---|---|
| Nov 11, 2022 | Sep 1, 2022 | 0.00 | — | — | — |
| Aug 10, 2022 | Jun 1, 2022 | 0.00 | — | — | — |
| May 16, 2022 | Mar 1, 2022 | -1.50 | — | — | — |
| Mar 30, 2022 | Dec 1, 2021 | 0.00 | — | — | — |
| Nov 12, 2021 | Sep 1, 2021 | -1.68 | — | — | — |
| Aug 11, 2021 | Jun 1, 2021 | -1.05 | — | — | — |
Upgrades / downgrades
| Date | Firm | Action | From | To |
|---|---|---|---|---|
| May 15, 2020 | Piper Sandler | down | Overweight | Neutral |
| Mar 10, 2020 | Stifel | down | Buy | Hold |
| Mar 5, 2020 | Stifel | main | — | Buy |
| Dec 12, 2019 | Stifel | init | — | Buy |
| May 23, 2019 | Seaport Global | init | — | Buy |
| Apr 15, 2019 | PiperJaffray | init | — | Overweight |
About U.S. Well Services, Inc.
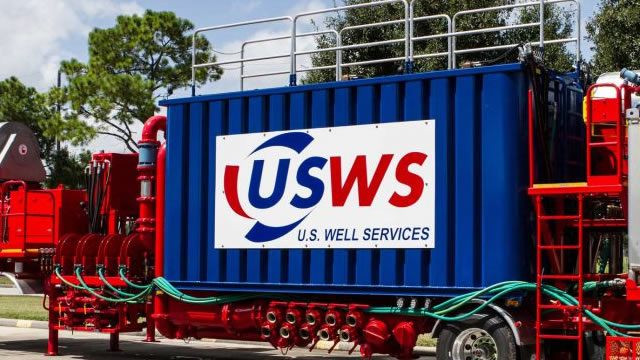
U.S. Well Services, Inc. operates as an oilfield service company in the United States. It provides pressure pumping services; and hydraulic fracturing services to the oil and natural gas exploration, and production companies. The company was founded in 2012 and is headquartered in Houston, Texas.
- Sector
- Energy
- Industry
- Oil & Gas Equipment & Services
- Country
- United States
- Website
- uswellservices.com
News
 TBLT, USWS: The Top 5 Short Squeeze Stocks to Watch This Week
 US Well Services, Inc. (USWS) CEO Kyle O'Neill on Q2 2022 Results - Earnings Call Transcript
 Earnings Scheduled For August 10, 2022
 U. S. Well Services Announces Second Quarter 2022 Earnings Release Date and Conference Call
 INVESTIGATION NOTICE: Halper Sadeh LLP Investigates USWS, GDST, NTUS, CMAX
 Why Shares Of US Well Services Are Trading Higher
 What to Know About Buying Penny Stocks on June 22nd
 Why ProFrac Holding (PFHC) Is Buying U.S. Well Services (USWS)
 5 Stocks To Watch For June 22, 2022
 U.S. Well Services: Little Clean Frac Player That Can Go Big
Your note
Sign in to keep a note on USWS — it syncs with the Stock Master app.
Insider holders
| Insider | Relation | Latest transaction | Date | Shares held |
|---|---|---|---|---|
| BERNARD MATTHEW | Officer | Stock Award(Grant) | Mar 13, 2019 | 246,206 |
| BROUSSARD JOEL | Chief Executive Officer | Stock Award(Grant) | Mar 13, 2019 | 1,483,090 |
| BURNETT RICHARD ALAN | Director | Stock Award(Grant) | Aug 15, 2021 | 91,708 |
| CRESTVIEW PARTNERS III GP, L.P. | Beneficial Owner of more than 10% of a Class of Security | Conversion of Exercise of derivative security | Sep 16, 2021 | 0 |
| HABACHY STEVE SAAD | Director | Stock Award(Grant) | Aug 15, 2021 | 59,406 |
| HOUSTON NATHAN | Chief Operating Officer | Stock Award(Grant) | Mar 13, 2019 | 283,632 |
Institution ownership
| Holder | % held | Shares | Value | Reported |
|---|---|---|---|---|
| Crestview Partners III GP, LP | 25.72% | 3,299,408 | 24.45M | Jun 29, 2022 |
| TCW Group, Inc. (The) | 13.98% | 1,792,866 | 13.29M | Sep 29, 2022 |
| Vanguard Group, Inc. (The) | 2.08% | 267,245 | 1.98M | Jun 29, 2022 |
| Ergoteles, LLC | 1.09% | 139,961 | 1.04M | Jun 29, 2022 |
| Geode Capital Management, LLC | 0.70% | 89,494 | 663.15K | Jun 29, 2022 |
| J. Goldman & Co., L.P. | 0.66% | 85,178 | 631.17K | Jun 29, 2022 |
Fund ownership
| Holder | % held | Shares | Value | Reported |
|---|---|---|---|---|
| Vanguard Total Stock Market Index Fund | 1.64% | 210,045 | 1.56M | Jun 29, 2022 |
| Vanguard Extended Market Index Fund | 0.41% | 52,209 | 386.87K | Jun 29, 2022 |
| Fidelity Extended Market Index Fund | 0.41% | 52,798 | 391.23K | Aug 30, 2022 |
| Fidelity NASDAQ Composite Index Fund | 0.09% | 11,083 | 82.13K | Aug 30, 2022 |
| Fidelity Total Market Index Fund | 0.08% | 10,317 | 76.45K | Aug 30, 2022 |
| Fidelity Series Total Market Index Fund | 0.08% | 10,076 | 74.66K | Aug 30, 2022 |