

United States Antimony Corporation UAMY
Nov 4, 2026, 9:41 AM EST
- YTD
- -38.65%
- 1 year
- -55.81%
- Market cap
- 460.98M
- Revenue (ttm)
- 39.04M
- Profit margin
- -41.44%
- EPS (ttm)
- -0.13
- Shares out
- 148.19M
- Forward P/E
- -171.25
- YTD return
- -38.65%
- 1-year return
- -55.81%
- Volume
- 478.79K
- Avg volume
- 6.32M
- Open
- 2.94
- Previous close
- 2.88
- Day's range
- 3.00 – 3.09
- 52-week range
- 2.64 – 12.64
- Beta
- 0.41
- Analysts
- Strong Buy
- Price target
- 12.56 (+307.9%)
- Earnings date
- Aug 11, 2026
5m -0.32 (-10.00%)
Key statistics
- Enterprise value
- 1.00B
- PEG ratio
- 0.00
- Price / sales
- 26.00
- Price / book
- 7.43
- Dividend yield
- 0.00%
- Payout ratio
- 0.00%
- Revenue growth
- -3.10%
- Free cash flow
- -62.35M
- Total cash
- 7.84M
- Total debt
- 199.86K
- Return on equity
- -19.67%
- Short % of float
- 21.67%
- 50-day average
- 6.84
- 200-day average
- 8.00
Analyst view
Consensus: strong buy
- Target (low)
- 11.75
- Target (mean)
- 12.56
- Target (high)
- 13.50
- Strong buy0
- Buy4
- Hold0
- Sell0
- Strong sell0
Next earnings
Aug 11, 2026
Expected Aug 11, 2026. Consensus EPS estimate -0.02.
Financials — quick view
Earnings
| Report date | Quarter ending | EPS estimate | EPS reported | Surprise | Surprise % |
|---|---|---|---|---|---|
| Aug 11, 2026 | Jun 30, 2026 | 0.00303 | — | — | — |
| May 14, 2026 | Mar 31, 2026 | -0.02 | -0.08 | -0.06 | -300.00% |
| Mar 19, 2026 | Dec 31, 2025 | -0.01 | -0.01 | 0.00 | 0.00% |
| Nov 12, 2025 | Sep 30, 2025 | 0.02 | -0.04 | -0.06 | -300.00% |
| Aug 12, 2025 | Jun 30, 2025 | 0.01 | 0.00143 | -0.01 | -85.70% |
| May 8, 2025 | Mar 31, 2025 | 0.01 | 0.00447 | -0.01 | -55.30% |
Upgrades / downgrades
| Date | Firm | Action | From | To |
|---|---|---|---|---|
| May 18, 2026 | HC Wainwright & Co. | main | Buy | Buy |
| Mar 23, 2026 | HC Wainwright & Co. | main | Buy | Buy |
| Feb 24, 2026 | B. Riley Securities | main | Buy | Buy |
| Feb 3, 2026 | HC Wainwright & Co. | reit | Buy | Buy |
| Nov 13, 2025 | HC Wainwright & Co. | main | Buy | Buy |
| Oct 20, 2025 | William Blair | init | — | Outperform |
About United States Antimony Corporation
United States Antimony Corporation produces and sells antimony, zeolite, and precious metals in the United States and Canada. It operates in two segments: Antimony and Zeolite. The company offers antimony trioxide that is primarily used in conjunction with a halogen to form a synergistic flame retardant system for plastics, rubber, fiberglass, textile goods, paints, coatings, and paper, as well as color fastener in paints and as a phosphorescent agent in fluorescent light bulbs; antimony metal for use in bearings, storage batteries, and ordnance; and antimony trisulfide used as a primer in ammunition. The company also offers coarse and fine zeolite for soil amendment and fertilizer, water filtration, mine underground ventilation, sewage treatment, nuclear waste and other environmental cleanup, odor control, gas separation, and animal nutrition applications, as well as catalysts, petroleum refining, concrete, solar energy and heat exchange, desiccants, pellet binding, horse and kitty litter, floor cleaner, traction control, ammonia removal from mining waste, and carriers for insecticides, pesticides and herbicides. In addition, it recovers unrefined and refined gold and silver. United States Antimony Corporation was founded in 1968 and is headquartered in Dallas, Texas.
- Sector
- Basic Materials
- Industry
- Other Industrial Metals & Mining
- Country
- United States
- Website
- usantimony.com
News
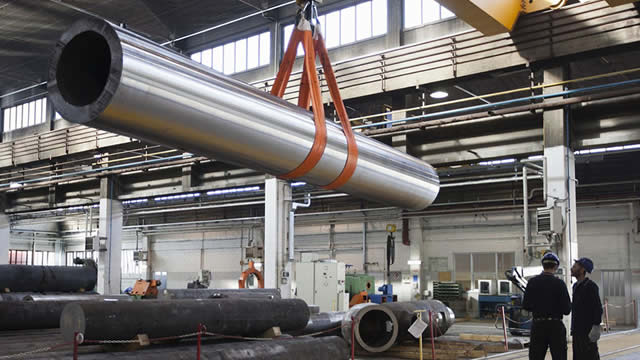 Critical Metals Drops 7% as European Lithium Deal Sets Up New Share Issuance; United States Antimony and USA Rare Earth Decline 3%, MP Materials Eases
 Why Is MP Materials Stock Surging on Tuesday?
 United States Antimony Completes New Technical Report On Gold-Antimony Resources At Nolan Creek, Alaska; Measured Resource Value Exceeds $314M And Inferred Resource Value Exceeds $125M
 Silence Therapeutics, Disc Medicine, Veradermics And Other Big Stocks Moving Higher On Monday
 Ladder Capital Posts Upbeat Q3 Earnings, Joins Alcoa, Hyster-Yale And Other Big Stocks Moving Higher On Friday
 The Joint U.S.-Ukrainian Reconstruction Investment Fund Has Sealed Its First Critical Minerals Deal Alongside Four Other New Projects
- United States Antimony Appoints Interim CFO Shawn P. Winkler As SVP And Permanent CFO
 Gold Gains 1%; Performance Food Group Shares Fall After Q4 Results
 National CineMedia Posts Downbeat Q2 Results, Joins Borr Drilling, AbCellera Biologics And Other Big Stocks Moving Lower In Wednesday’s Pre-Market Session
 Why CoreWeave Shares Are Trading Higher By Over 17%; Here Are 20 Stocks Moving Premarket
Your note
Sign in to keep a note on UAMY — it syncs with the Stock Master app.
Insider holders
| Insider | Relation | Latest transaction | Date | Shares held |
|---|---|---|---|---|
| AGUIRRE BLAISE A. M.D. | Director | Stock Award(Grant) | Jan 14, 2026 | 496,001 |
| CARRABBA JOSEPH A | Director | Stock Award(Grant) | Jan 14, 2026 | 112,702 |
| EVANS GARY C | Chief Executive Officer | Purchase | Sep 25, 2025 | 2,378,820 |
| HUBERT RACHEL | Officer | Purchase | Aug 14, 2024 | 7,500 |
| ISAAK RICHARD R | Chief Financial Officer | Purchase | Sep 8, 2024 | 71,667 |
| MARINELLI JON R. | Director | Purchase | Jun 14, 2026 | 12,500 |
Institution ownership
| Holder | % held | Shares | Value | Reported |
|---|---|---|---|---|
| Blackrock Inc. | 7.66% | 11,345,023 | 77.71M | Jun 29, 2026 |
| State Street Corporation | 7.65% | 11,339,710 | 77.68M | Jun 29, 2026 |
| Van Eck Associates Corporation | 7.00% | 10,369,695 | 71.03M | Mar 30, 2026 |
| Driehaus Capital Management, LLC | 3.61% | 5,345,710 | 36.62M | Mar 30, 2026 |
| Vanguard Capital Management LLC | 3.51% | 5,200,486 | 35.62M | Mar 30, 2026 |
| Hood River Capital Management LLC | 1.86% | 2,759,376 | 18.90M | Mar 30, 2026 |
Fund ownership
| Holder | % held | Shares | Value | Reported |
|---|---|---|---|---|
| SPDR SERIES TRUST-State Street SPDR S&P Metals & Mining ETF | 5.65% | 8,372,515 | 57.35M | Jun 29, 2026 |
| VanEck ETF Trust-VanEck Rare Earth and Strategic Metals ETF | 3.67% | 5,445,817 | 37.30M | Jun 29, 2026 |
| VANGUARD INDEX FUNDS-Vanguard Total Stock Market Index Fund | 2.52% | 3,739,500 | 25.62M | Mar 30, 2026 |
| iShares Trust-iShares Russell 2000 ETF | 2.37% | 3,512,674 | 24.06M | Jun 29, 2026 |
| Manager Directed Portfolios-Hood River Small-Cap Growth Fund | 1.42% | 2,098,608 | 14.38M | Apr 29, 2026 |
| Columbia Funds Series Trust I-Columbia Small Cap Growth Fund | 1.05% | 1,552,391 | 10.63M | May 30, 2026 |