

Tuya Inc. TUYA
Nov 3, 2026, 3:40 PM EST
- YTD
- -24.41%
- 1 year
- -30.95%
- Market cap
- 977.96M
- Revenue (ttm)
- 340.79M
- Profit margin
- 20.16%
- EPS (ttm)
- 0.11
- Shares out
- 542.98M
- P/E ratio
- 14.50
- Forward P/E
- 12.30
- Dividend
- 0.06
- Ex-dividend date
- Mar 17, 2026
- YTD return
- -24.41%
- 1-year return
- -30.95%
- Volume
- 386.51K
- Avg volume
- 554.84K
- Open
- 1.63
- Previous close
- 1.60
- Day's range
- 1.57 – 1.63
- 52-week range
- 1.56 – 2.61
- Beta
- 0.52
- Price target
- 3.17 (+98.6%)
- Earnings date
- Nov 23, 2026
30m -0.05 (-3.03%)
Key statistics
- Enterprise value
- 14.29M
- PEG ratio
- 0.00
- Price / sales
- 2.99
- Price / book
- 0.99
- Dividend yield
- 3.78%
- Payout ratio
- 104.09%
- Revenue growth
- 16.00%
- Free cash flow
- 436.38K
- Total cash
- 979.88M
- Total debt
- 9.32M
- Return on equity
- 6.74%
- Short % of float
- 0.46%
- 50-day average
- 1.75
- 200-day average
- 2.03
Analyst view
- Target (low)
- 2.70
- Target (mean)
- 3.17
- Target (high)
- 3.87
- Strong buy1
- Buy3
- Hold0
- Sell0
- Strong sell0
Next earnings
Nov 23, 2026
Expected Nov 23, 2026. Consensus EPS estimate 0.03.
Financials — quick view
Earnings
| Report date | Quarter ending | EPS estimate | EPS reported | Surprise | Surprise % |
|---|---|---|---|---|---|
| Nov 23, 2026 | Sep 30, 2026 | 0.03 | — | — | — |
| Aug 24, 2026 | Jun 30, 2026 | 0.03 | 0.03 | 0.00 | 0.00% |
| May 11, 2026 | Mar 31, 2026 | 0.03 | 0.03 | 0.00 | 0.00% |
| Mar 2, 2026 | Dec 31, 2025 | 0.03 | 0.03 | 0.00 | 0.00% |
| Nov 24, 2025 | Sep 30, 2025 | 0.03 | 0.03 | 0.00 | 0.00% |
| Aug 26, 2025 | Jun 30, 2025 | 0.03 | 0.03 | 0.00 | 0.00% |
Upgrades / downgrades
| Date | Firm | Action | From | To |
|---|---|---|---|---|
| Aug 5, 2025 | Jefferies | init | — | Buy |
| Nov 29, 2023 | Morgan Stanley | up | Equal-Weight | Overweight |
| May 14, 2021 | B of A Securities | up | Neutral | Buy |
| Apr 12, 2021 | Morgan Stanley | init | — | Overweight |
About Tuya Inc.
Tuya Inc. provides artificial intelligence (AI) cloud platform services in the People's Republic of China. Its AI cloud developer platform delivers a suite of offerings, including platform-as-a-service (PaaS), software-as-a-service (SaaS), and smart solutions to developers of smart device, commercial applications, and industries. The company's PaaS offering enables original equipment manufacturers and brands, and developers to develop, launch, manage, and monetize software-enabled smart devices and services. Its SaaS offering enables businesses to deploy, connect, and manage smart devices in various vertical scenarios for spatial intelligence and cloud-based software value-added services to build their own autonomous and controllable smart business platforms. Its solutions include cube private cloud, smart hospitality, smart residential, commercial lighting, and smart house and real estate. The company also offers a range of other cloud-based value-added services to enhance their ability to develop and manage IoT experiences for businesses, developers, and end users. In addition, it provides smart solutions for smart devices integrated with AI and intelligent software capabilities. The company serves brands, original equipment manufacturers, industry operators, and system integrators across a range of industry verticals, such as smart home and business, renewable energy, education, agriculture, outdoors and sport, and entertainment. Tuya Inc. was founded in 2014 and is based in Hangzhou, the People's Republic of China.
- Sector
- Technology
- Industry
- Software - Infrastructure
- Country
- China
- Website
- tuya.com
News
 Conow Launches Award-Winning Atlas 6000 AC in Germany, Advancing AI-Driven Home Energy Management
 Tuya's 2026 Outlook: Software Strategy Drives Sustained Margin Expansion
 Transcript: Tuya Q2 2026 Earnings Conference Call
 Analyzing Marchex (NASDAQ:MCHX) and Tuya (NYSE:TUYA)
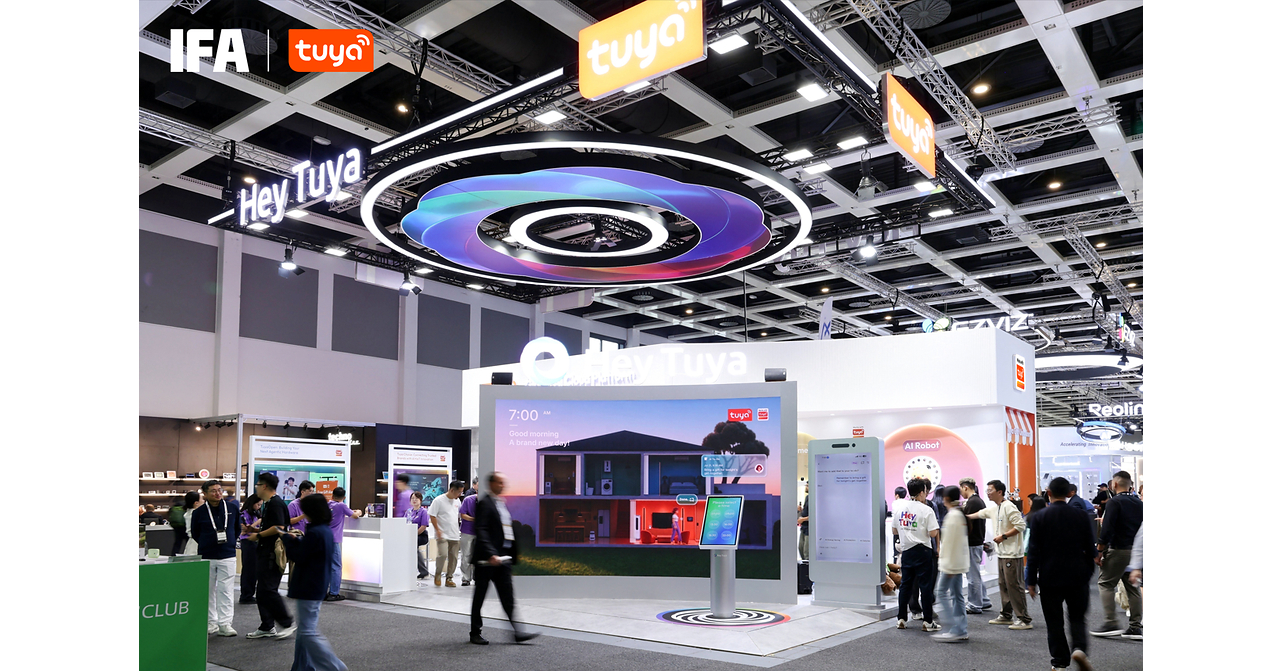 Tuya Smart lleva la IA integral a la vida cotidiana en IFA 2026
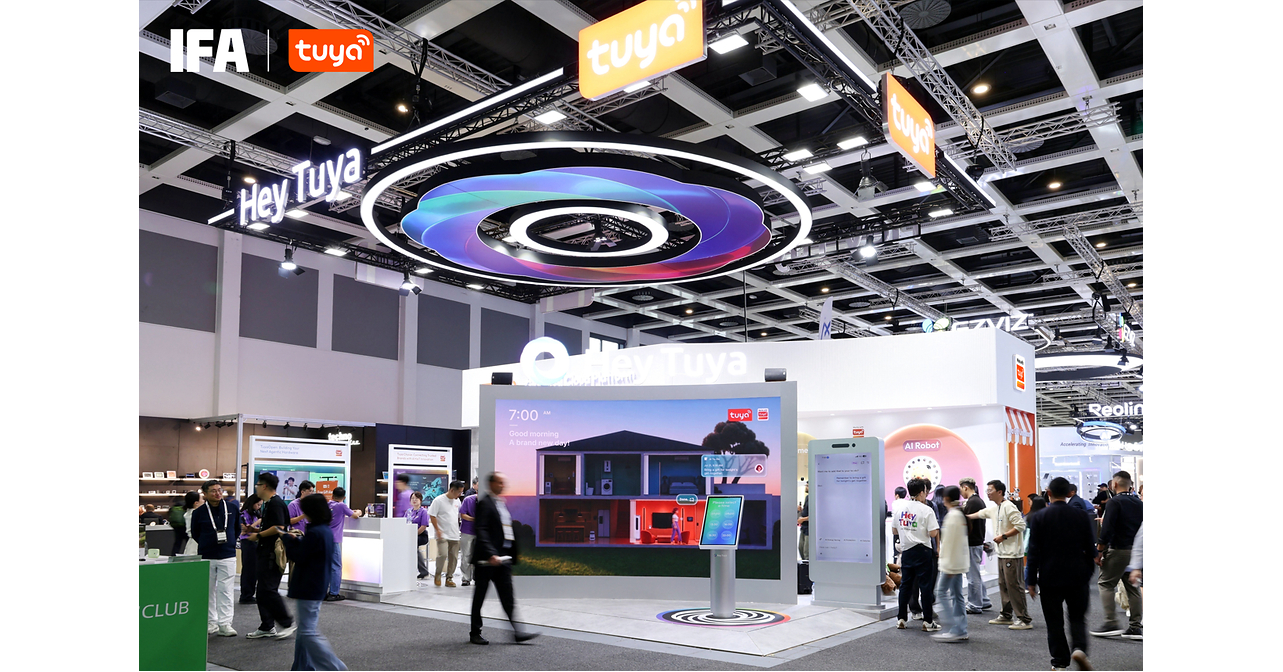 Tuya Smart bringt auf der IFA 2026 Full-Stack-KI in den Alltag
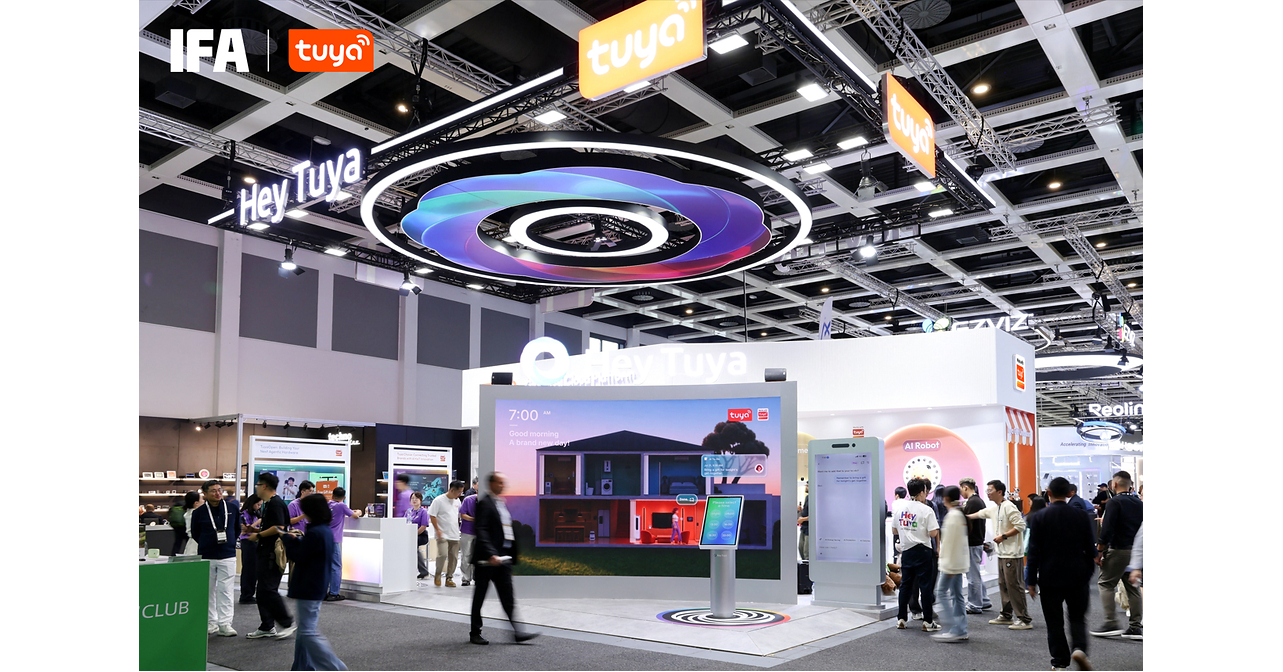 Tuya Smart intègre l'IA full-stack au quotidien au cours d'IFA 2026
 Tuya Smart presenta Doova en la IFA 2026
 Tuya Smart stellt auf der IFA 2026 Doova vor, einen KI-Begleitroboter für zu Hause, um selbstständig lebende Senioren zu unterstützen
 Tuya Smart dévoile Doova à l'IFA 2026, un robot IA d'assistance domestique conçu pour aider les seniors à vivre de manière autonome
Your note
Sign in to keep a note on TUYA — it syncs with the Stock Master app.
Institution ownership
| Holder | % held | Shares | Value | Reported |
|---|---|---|---|---|
| Anchor @ 65 Pte. Ltd. | 13.74% | 74,626,900 | 123.88M | Jun 29, 2026 |
| FIL LTD | 2.72% | 14,760,337 | 24.50M | Jun 29, 2026 |
| Vanguard Capital Management LLC | 1.96% | 10,653,856 | 17.69M | Jun 29, 2026 |
| Principal Financial Group, Inc. | 1.76% | 9,578,181 | 15.90M | Jun 29, 2026 |
| Blackrock Inc. | 1.13% | 6,128,712 | 10.17M | Jun 29, 2026 |
| Manufacturers Life Insurance Co. | 0.71% | 3,846,202 | 6.38M | Jun 29, 2026 |
Fund ownership
| Holder | % held | Shares | Value | Reported |
|---|---|---|---|---|
| VANGUARD STAR FUNDS-Vanguard Total International Stock Index Fund | 0.87% | 4,722,359 | 7.84M | Jul 30, 2026 |
| VANGUARD Intl Eqy. INDEX Fd.S-Vanguard Emerging Markets Stock Index Fd | 0.82% | 4,427,941 | 7.35M | Jul 30, 2026 |
| iShares, Inc.-iShares Core MSCI Emerging Markets ETF | 0.59% | 3,223,733 | 5.35M | Sep 29, 2026 |
| VANGUARD Intl Eqy. INDEX Fd.S-Vanguard FTSE All-World ex-US Small-Cap | 0.22% | 1,182,130 | 1.96M | Jul 30, 2026 |
| College Retirement Equities Fd.-College Retirement Equities Fd. - Tota | 0.20% | 1,073,017 | 1.78M | Jun 29, 2026 |
| VANGUARD Intl Eqy. INDEX Fd.S-Vanguard Total World Stock ETF | 0.05% | 275,485 | 457.31K | Jul 30, 2026 |