

Traton SE TRATF
37.75 USD 0.00 (+0.00%)
At closeNov 4, 2026, 4:00 PM EST
37.38 Day range 37.38
30.65 52-week range 46.07
- YTD
- +9.60%
- 1 year
- +23.15%
- Market cap
- 19.64B
- EPS (ttm)
- 7.24
- P/E ratio
- 5.21
- YTD return
- +9.60%
- 1-year return
- +23.15%
- Volume
- 348
- Avg volume
- 81
- Open
- 37.38
- Previous close
- 37.75
- Day's range
- 37.38 – 37.38
- 52-week range
- 30.65 – 46.07
- Earnings date
- Oct 28, 2026
2Y +5.24 (+16.12%)
Next earnings
Oct 28, 2026
Expected Oct 28, 2026. Consensus EPS estimate 1.35.
Earnings
| Report date | Quarter ending | EPS estimate | EPS reported | Surprise | Surprise % |
|---|---|---|---|---|---|
| Oct 28, 2026 | Sep 30, 2026 | 1.35 | — | — | — |
| Jul 23, 2026 | Jun 30, 2026 | 1.37 | 1.62 | +0.25 | +18.25% |
| Apr 29, 2026 | Mar 31, 2026 | 0.821 | 0.52 | -0.30 | -36.66% |
| Mar 4, 2026 | Dec 31, 2025 | 1.11 | 1.20 | +0.09 | +8.11% |
| Oct 29, 2025 | Sep 30, 2025 | 0.975 | 0.76 | -0.21 | -22.05% |
| Jul 25, 2025 | Jun 30, 2025 | 1.06 | 0.578 | -0.48 | -45.47% |
News
 Traton's nine-month operating profit rises 13% on volume, pricing and product mix
 Traton SE ADR (TRATY) Q1 2026 Earnings Call Transcript
 Traton (TRATF) Expected to Announce Earnings on Wednesday
 Daimler Truck Vs. Traton: The Trough Reveals It All
 Traton SE ADR (TRATY) Q4 2025 Earnings Call Transcript
 Traton's Earnings Fall as Trade Disruption Hits Sales
 Traton and PlusAI Expand Partnership to Accelerate Launch of Autonomous Trucks
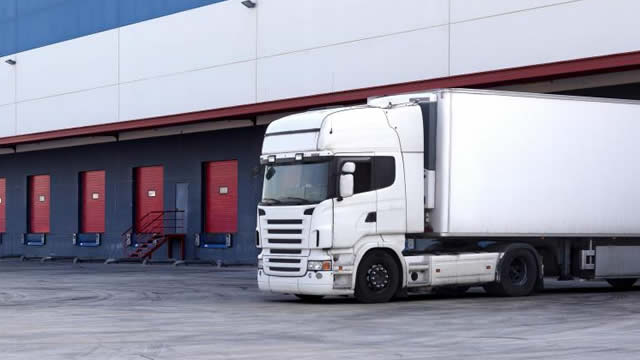 Traton Expects Net Cash Flow to Beat Guidance, Market Views
 Traton reports full-year cash flow ahead of market expectations
 Traton SE ADR (TRATY) Q3 2025 Earnings Call Transcript
Your note
Sign in to keep a note on TRATF — it syncs with the Stock Master app.