

Tidewater Inc. TDW
At closeNov 11, 2026, 4:00 PM EST
After hours · Nov 11, 4:00 PM ET
- YTD
- +56.23%
- 1 year
- +33.93%
- Market cap
- 3.92B
- Revenue (ttm)
- 1.37B
- Profit margin
- 19.42%
- EPS (ttm)
- 5.28
- Shares out
- 49.66M
- P/E ratio
- 14.95
- Forward P/E
- 14.07
- YTD return
- +56.23%
- 1-year return
- +33.93%
- Volume
- 1.03M
- Avg volume
- 615.21K
- Open
- 76.40
- Previous close
- 73.98
- Day's range
- 74.74 – 79.50
- 52-week range
- 49.54 – 101.58
- Beta
- 0.61
- Analysts
- Buy
- Price target
- 97.63 (+23.7%)
- Earnings date
- Mar 1, 2027
5D +4.72 (+6.40%)
Key statistics
- Enterprise value
- 4.14B
- PEG ratio
- 0.00
- Price / sales
- 2.87
- Price / book
- 2.79
- Dividend yield
- 0.00%
- Payout ratio
- 0.00%
- Revenue growth
- 5.70%
- Free cash flow
- 376.31M
- Total cash
- 390.84M
- Total debt
- 862.26M
- Return on equity
- 20.77%
- Short % of float
- 15.54%
- 50-day average
- 84.50
- 200-day average
- 79.93
Analyst view
Consensus: buy
- Target (low)
- 75.00
- Target (mean)
- 97.63
- Target (high)
- 120.00
- Strong buy2
- Buy2
- Hold3
- Sell0
- Strong sell1
Next earnings
Mar 1, 2027
Expected Mar 1, 2027. Consensus EPS estimate 1.04.
Financials — quick view
Earnings
| Report date | Quarter ending | EPS estimate | EPS reported | Surprise | Surprise % |
|---|---|---|---|---|---|
| Mar 1, 2027 | Dec 30, 2026 | 1.59 | — | — | — |
| Nov 9, 2026 | Sep 30, 2026 | 0.719 | 0.35 | -0.37 | -51.32% |
| Aug 3, 2026 | Jun 30, 2026 | 0.4562 | 0.43 | -0.03 | -5.74% |
| May 4, 2026 | Mar 31, 2026 | 0.75 | 0.12 | -0.63 | -84.00% |
| Mar 2, 2026 | Dec 31, 2025 | 0.771 | 4.41 | +3.64 | +471.98% |
| Nov 10, 2025 | Sep 30, 2025 | 0.46 | 0.53 | +0.07 | +15.22% |
Upgrades / downgrades
| Date | Firm | Action | From | To |
|---|---|---|---|---|
| Oct 9, 2026 | BTIG | reit | Buy | Buy |
| Sep 1, 2026 | BTIG | up | Neutral | Buy |
| Aug 13, 2026 | Barclays | main | Equal-Weight | Equal-Weight |
| May 8, 2026 | Barclays | main | Equal-Weight | Equal-Weight |
| Apr 1, 2026 | Barclays | init | — | Equal-Weight |
| Mar 4, 2026 | Evercore ISI Group | main | In-Line | In-Line |
About Tidewater Inc.
Tidewater Inc., together with its subsidiaries, provides offshore support vessels and marine support services to the offshore energy industry through the operation of a fleet of offshore marine service vessels worldwide. The company operates through five segments: Americas, Asia Pacific, Middle East, Europe/Mediterranean, and West Africa. It offers phases of offshore crude oil and natural gas exploration, field development, production, maintenance, and windfarm development and maintenance activities; towing and anchor handling for mobile offshore drilling units; transportation of supplies and personnel necessary to sustain drilling, workover, and production operations; and field abandonment, dismantlement, and restoration activities. The company also provides offshore construction; seismic and subsea support; various other specialized services, such as pipe laying, cable laying, and geotechnical survey support for windfarm construction. Its vessels consist of anchor handling towing supply vessels, platform supply vessels, and other specialty vessels, as well as crew boats, utility vessels, and offshore tugs. The company serves integrated and independent oil and gas exploration, development, and production companies; mid-sized and smaller independent exploration and production companies; foreign government-owned or government-controlled organizations engaged in the exploration, development, and production of oil and gas; offshore drilling contractors; and other companies that provide services to the offshore energy industry comprising offshore construction companies, windfarm development companies, diving companies, and well stimulation companies. Tidewater Inc. was incorporated in 1956 and is headquartered in Houston, Texas.
- Sector
- Energy
- Industry
- Oil & Gas Equipment & Services
- Country
- United States
- Website
- tdw.com
News
 What Tidewater (TDW) Said on Its Q3 Earnings Call
 Tidewater Inc. (TDW) Q3 2026 Earnings Call Transcript
 Tidewater Q3 2026 Earnings Call Transcript
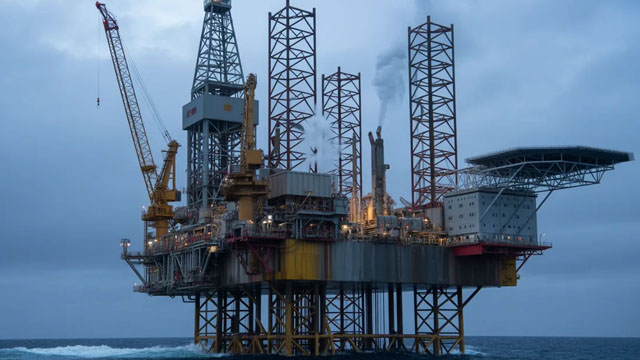 Tidewater (TDW) Lags Q3 Earnings Estimates
 Tidewater Narrows FY2026 Sales Guidance from $1.420B-$1.470B to $1.430B-$1.440B vs $1.443B Est
 Tidewater Reports Results for the Nine Months Ended September 30, 2026
 This Robinhood Analyst Turns Bullish; Here Are Top 5 Upgrades For Tuesday
 Barclays Maintains Equal-Weight on Tidewater, Raises Price Target to $91
 Tidewater Lowers FY2026 Sales Guidance from $1.430B-$1.480B to $1.420B-$1.470B vs $1.452B Est
 Barclays Maintains Equal-Weight on Tidewater, Raises Price Target to $86
Your note
Sign in to keep a note on TDW — it syncs with the Stock Master app.
Insider holders
| Insider | Relation | Latest transaction | Date | Shares held |
|---|---|---|---|---|
| ANDERSON DARRON M. | Director | Stock Award(Grant) | Jun 4, 2025 | 44,729 |
| DARLING DAVID E | Chief Operating Officer | Stock Award(Grant) | Mar 17, 2025 | 77,351 |
| FAGERSTAL DICK H | Director | Stock Award(Grant) | Jun 15, 2026 | 75,592 |
| HUDSON DANIEL ALLEN | Officer | Sale | Sep 1, 2026 | 33,029 |
| KNEEN QUINTIN V | Chief Executive Officer | Stock Award(Grant) | Mar 17, 2026 | 373,063 |
| RASPINO LOUIS A | Director | Stock Award(Grant) | Jun 15, 2026 | 48,551 |
Institution ownership
| Holder | % held | Shares | Value | Reported |
|---|---|---|---|---|
| Blackrock Inc. | 15.21% | 7,552,159 | 595.94M | Jun 29, 2026 |
| Price (T.Rowe) Associates Inc | 7.42% | 3,683,612 | 290.67M | Jun 29, 2026 |
| Robotti Robert | 5.85% | 2,906,380 | 229.34M | Jun 29, 2026 |
| Neuberger Berman Group, LLC | 5.64% | 2,803,406 | 221.22M | Jun 29, 2026 |
| Vanguard Portfolio Management LLC | 5.56% | 2,762,204 | 217.97M | Jun 29, 2026 |
| Dimensional Fund Advisors LP | 4.47% | 2,217,691 | 175.00M | Sep 29, 2026 |
Fund ownership
| Holder | % held | Shares | Value | Reported |
|---|---|---|---|---|
| iShares Trust-iShares Core S&P Small-Cap ETF | 5.58% | 2,770,087 | 218.59M | Sep 29, 2026 |
| American Century ETF Trust-Avantis U.S. Small Cap Value ETF | 3.05% | 1,515,407 | 119.58M | Sep 29, 2026 |
| VANGUARD INDEX FUNDS-Vanguard Total Stock Market Index Fund | 2.70% | 1,340,849 | 105.81M | Jun 29, 2026 |
| NEUBERGER BERMAN EQUITY FUNDS-Neuberger Genesis Fund | 2.68% | 1,331,336 | 105.06M | Sep 29, 2026 |
| iShares Trust-iShares Russell 2000 ETF | 2.61% | 1,297,968 | 102.42M | Sep 29, 2026 |
| T. Rowe Price Mid-Cap Value Fund, Inc. | 2.49% | 1,234,293 | 97.40M | Jun 29, 2026 |