

Trade School Go, Inc. TAPM
0.12 USD 0.00 (+0.00%)
Jul 20, 2026, 9:30 AM EDT
0.12 Day range 0.12
0.111 52-week range 0.46
- YTD
- -68.43%
- 1 year
- -73.91%
- Market cap
- 327.05K
- EPS (ttm)
- -0.04
- P/E ratio
- -3.00
- YTD return
- -68.43%
- 1-year return
- -73.91%
- Volume
- 725
- Avg volume
- 664
- Open
- 0.12
- Previous close
- 0.12
- Day's range
- 0.12 – 0.12
- 52-week range
- 0.111 – 0.46
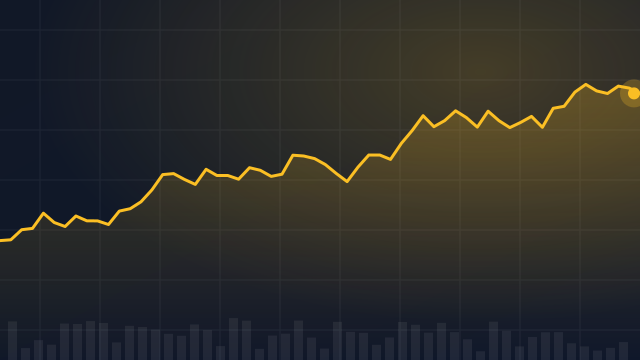
2Y -0.1600 (-51.58%)
Earnings
| Report date | Quarter ending | EPS estimate | EPS reported | Surprise | Surprise % |
|---|---|---|---|---|---|
| Nov 13, 2024 | Sep 1, 2024 | 0.00 | -0.05 | — | — |
| Aug 12, 2024 | Jun 1, 2024 | 0.00 | 0.00 | — | — |
| May 14, 2024 | Mar 1, 2024 | 0.00 | 0.05 | — | — |
| Mar 12, 2024 | Dec 1, 2023 | 0.00 | 0.02 | — | — |
| Nov 13, 2023 | Sep 1, 2023 | 0.00 | -0.11 | — | — |
| Aug 11, 2023 | Jun 1, 2023 | 0.00 | 0.03 | — | — |
News
 TradeSchoolGo.com Launches to Expand Access to Trade Education - Connecting Aspiring Students with Accredited Trade School Programs
 Tapinator (OTCMKTS:TAPM) vs. Hello Group (NASDAQ:MOMO) Head-To-Head Survey
 Tapinator (OTCMKTS:TAPM) Stock Crosses Below 50 Day Moving Average – Time to Sell?
 Tapinator Announces Q2 2024 Financial Results
 Tapinator Announces Q1 2024 Financial Results
 Tapinator Announces 2023 Annual and Fourth Quarter Results
 Tapinator Announces Q3 2023 Financial Results
 Tapinator Announces Q2 2023 Financial Results
 Stocks That Hit 52-Week Lows On Tuesday
- Stocks That Hit 52-Week Lows On Wednesday
Your note
Sign in to keep a note on TAPM — it syncs with the Stock Master app.