

Rivian Automotive, Inc. RIVN
At closeNov 12, 2026, 7:51 PM EST
After hours · Nov 12, 7:51 PM ET
- YTD
- -35.06%
- 1 year
- -26.94%
- Market cap
- 18.68B
- Revenue (ttm)
- 6.48B
- Profit margin
- -45.88%
- EPS (ttm)
- -2.14
- Shares out
- 1.46B
- Forward P/E
- -7.25
- YTD return
- -35.06%
- 1-year return
- -26.94%
- Volume
- 25.73M
- Avg volume
- 25.68M
- Open
- 13.18
- Previous close
- 13.54
- Day's range
- 12.78 – 13.33
- 52-week range
- 11.38 – 22.69
- Beta
- 1.64
- Analysts
- Buy
- Price target
- 18.08 (+41.2%)
- Earnings date
- Feb 11, 2027
5D -0.46 (-3.47%)
Key statistics
- Enterprise value
- 19.72B
- PEG ratio
- 0.00
- Price / sales
- 2.88
- Price / book
- 3.28
- Dividend yield
- 0.00%
- Payout ratio
- 0.00%
- Revenue growth
- 38.30%
- Free cash flow
- -2.19B
- Total cash
- 5.50B
- Total debt
- 5.43B
- Return on equity
- -54.88%
- Short % of float
- 15.14%
- 50-day average
- 14.08
- 200-day average
- 15.36
Analyst view
Consensus: buy
- Target (low)
- 10.00
- Target (mean)
- 18.08
- Target (high)
- 25.00
- Strong buy4
- Buy10
- Hold6
- Sell3
- Strong sell2
Next earnings
Feb 11, 2027
Expected Feb 11, 2027. Consensus EPS estimate -0.53567.
Financials — quick view
Earnings
| Report date | Quarter ending | EPS estimate | EPS reported | Surprise | Surprise % |
|---|---|---|---|---|---|
| Feb 11, 2027 | Dec 30, 2026 | -0.55 | — | — | — |
| Oct 29, 2026 | Sep 30, 2026 | -0.64376 | -0.48 | +0.16 | +25.44% |
| Jul 30, 2026 | Jun 30, 2026 | -0.66295 | -0.47 | +0.19 | +29.10% |
| Apr 30, 2026 | Mar 31, 2026 | -0.6323 | -0.55 | +0.08 | +13.02% |
| Feb 12, 2026 | Dec 31, 2025 | -0.70845 | -0.54 | +0.17 | +23.78% |
| Nov 4, 2025 | Sep 30, 2025 | -0.73934 | -0.70 | +0.04 | +5.32% |
Upgrades / downgrades
| Date | Firm | Action | From | To |
|---|---|---|---|---|
| Nov 9, 2026 | Stifel | reit | Buy | Buy |
| Nov 6, 2026 | DA Davidson | main | Neutral | Neutral |
| Nov 2, 2026 | UBS | up | Neutral | Buy |
| Oct 30, 2026 | Jefferies | up | Hold | Buy |
| Oct 30, 2026 | Cantor Fitzgerald | main | Neutral | Neutral |
| Oct 30, 2026 | Needham | main | Buy | Buy |
About Rivian Automotive, Inc.
Rivian Automotive, Inc., together with its subsidiaries, develops, manufactures, and sells category-defining electric vehicles. It operates through two segments, Automotive, and Software and Services. The company offers consumer vehicles, including a two-row, five-passenger pickup truck under the R1T brand; and a three-row, seven-passenger sport utility vehicle under the R1S name. It also provides software and services, such as vehicle electrical architecture and software development, as well as Autonomy+, remarketing, vehicle repair and maintenance services, software subscriptions, vehicle accessories, financing, insurance, and other services. In addition, the company designs, develops, and manufactures the Rivian Adventure Network Direct Current fast chargers; and FleetOS, a proprietary, end-to-end centralized fleet management subscription platform. Further, it offers Rivian Commercial Van platform for Electric Delivery Van with collaboration with Amazon.com, Inc. Rivian Automotive, Inc. was founded in 2009 and is based in Irvine, California.
- Sector
- Consumer Cyclical
- Industry
- Auto Manufacturers
- Country
- United States
- Website
- rivian.com
News
 If the Fed Keeps Cutting Rates, History Says These 3 Industrial Stocks Win
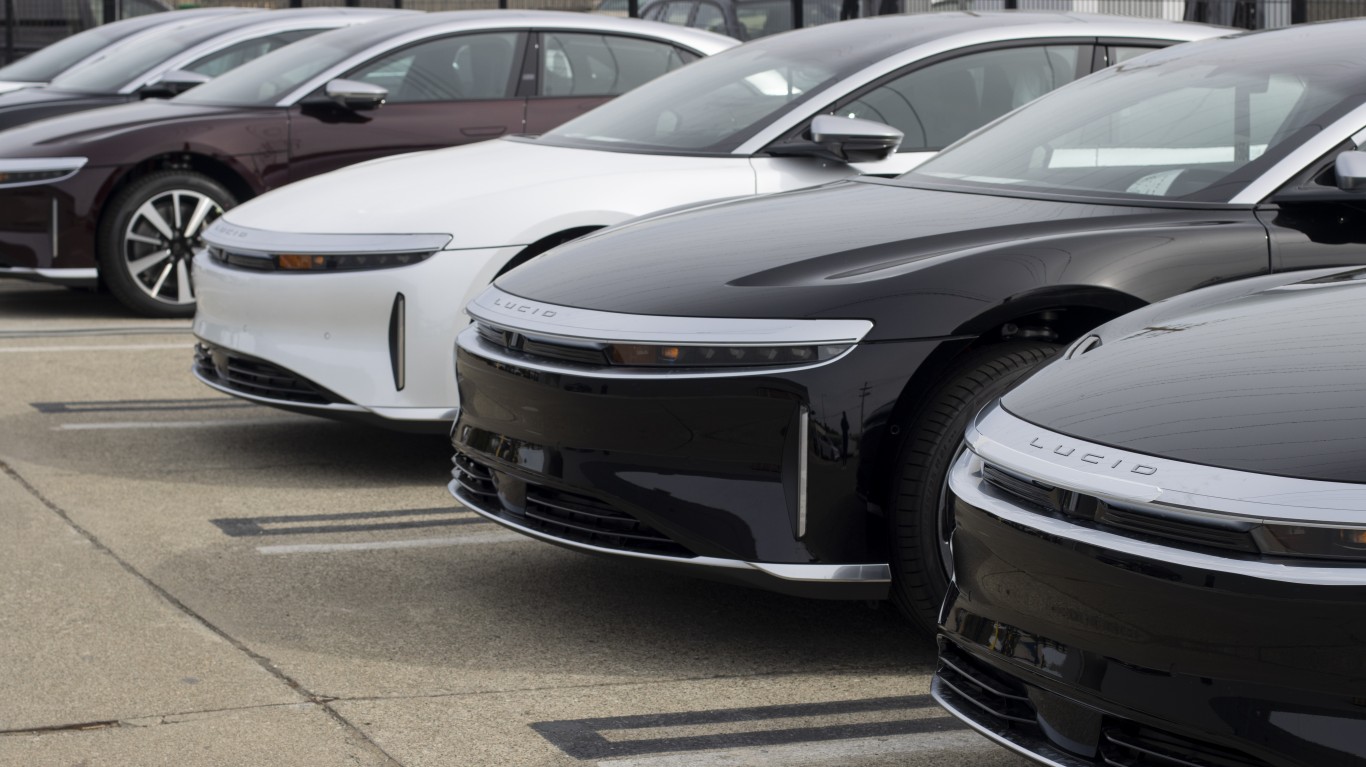 Lucid Sinks 8% as Cash-Burn Worries Linger After Earnings; Rivian Falls 3%, Tesla Holds Steady After Musk’s Jensen Huang Remark
 Rivian Just Earned a Buy Rating. Is Wall Street Seeing a Turning Point?
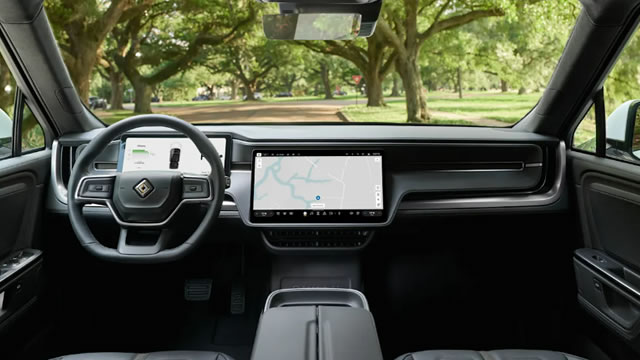 Rivian: Something Has To Give
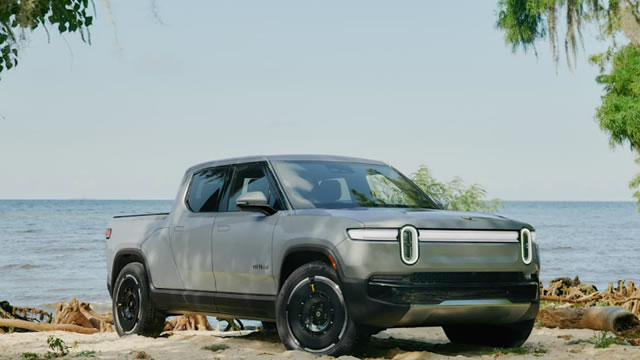 Rivian: Oversold As R2 Ramps Up - Promising Electric Van Tailwinds Ahead
 Tesla Rises 4% as Finland Clears Its Driver-Assistance System Ahead of EU Vote; Lucid Slides 2% After Citi Cut, Rivian Dips
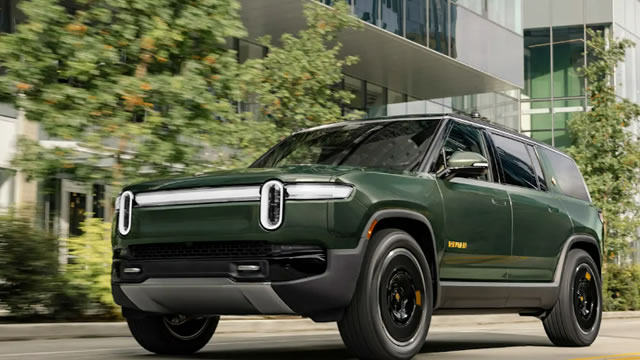 Rivian's Vans Got a Serious Upgrade. Could Another Major Fleet Deal Finally Follow?
 Rivian's Deliveries Jumped 58%. Why Didn't Gross Profit Follow?
 'Rivian CEO says new R2 SUV, autonomy make 2027 an ‘inflection year’ as EV maker marks five years since IPO' - CNBC
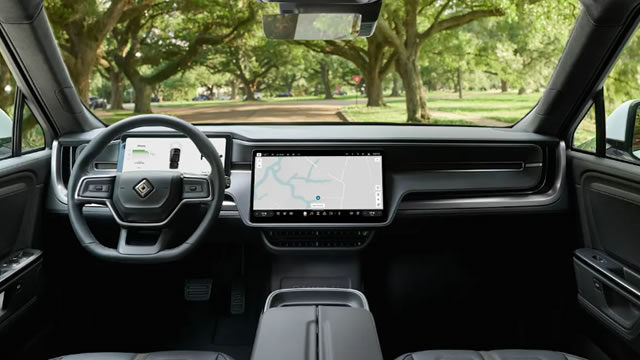 Rivian CEO says new R2 SUV, autonomy make 2027 an ‘inflection year' as EV maker marks five years since IPO
Your note
Sign in to keep a note on RIVN — it syncs with the Stock Master app.
Insider holders
| Insider | Relation | Latest transaction | Date | Shares held |
|---|---|---|---|---|
| BOONE KAREN | Director | Sale | Jul 5, 2026 | 0 |
| CALLAHAN MICHAEL JOHN | Officer | Sale | Sep 10, 2026 | 1,016,780 |
| FLATLEY JAY T | Director | Stock Award(Grant) | Jun 21, 2026 | 179,515 |
| KRAWIEC PETER | Director | Stock Award(Grant) | Oct 19, 2026 | 124,917 |
| MARCARIO ROSE M. | Director | Stock Award(Grant) | Jun 17, 2025 | 125,594 |
| MCDONOUGH CLAIRE | Chief Financial Officer | Sale | Aug 19, 2026 | 819,178 |
Institution ownership
| Holder | % held | Shares | Value | Reported |
|---|---|---|---|---|
| Amazon.com, Inc. | 10.88% | 158,363,834 | 2.03B | Sep 29, 2026 |
| Blackrock Inc. | 3.88% | 56,419,011 | 722.16M | Jun 29, 2026 |
| BAILLIE GIFFORD & CO | 2.87% | 41,758,982 | 534.51M | Sep 29, 2026 |
| Vanguard Capital Management LLC | 2.70% | 39,268,910 | 502.64M | Jun 29, 2026 |
| Vanguard Portfolio Management LLC | 2.39% | 34,835,795 | 445.90M | Jun 29, 2026 |
| JPMORGAN CHASE & CO | 1.56% | 22,651,249 | 289.94M | Jun 29, 2026 |
Fund ownership
| Holder | % held | Shares | Value | Reported |
|---|---|---|---|---|
| VANGUARD INDEX FUNDS-Vanguard Total Stock Market Index Fund | 1.92% | 27,930,998 | 357.52M | Jun 29, 2026 |
| Growth Fund of America | 1.45% | 21,155,295 | 270.79M | Sep 29, 2026 |
| VANGUARD INDEX FUNDS-Vanguard Small-Cap Index Fund | 1.39% | 20,164,071 | 258.10M | Jun 29, 2026 |
| VANGUARD INDEX FUNDS-Vanguard Small-Cap Growth Index Fund | 0.80% | 11,598,443 | 148.46M | Jun 29, 2026 |
| VANGUARD INDEX FUNDS-Vanguard Extended Market Index Fund | 0.66% | 9,658,912 | 123.63M | Jun 29, 2026 |
| AMERICAN FUNDS INSURANCE SERIES-Growth Fund | 0.54% | 7,798,201 | 99.82M | Sep 29, 2026 |