

Qnity Electronics, Inc. Q
At closeNov 9, 2026, 7:53 PM EST
After hours · Nov 9, 7:53 PM ET
- YTD
- +53.20%
- 1 year
- +35.51%
- Market cap
- 26.15B
- Revenue (ttm)
- 5.49B
- Profit margin
- 10.16%
- EPS (ttm)
- 2.66
- Shares out
- 209.04M
- P/E ratio
- 47.03
- Forward P/E
- 20.89
- Dividend
- 0.32 (0.27%)
- Ex-dividend date
- Nov 29, 2026
- YTD return
- +53.20%
- 1-year return
- +35.51%
- Volume
- 2.64M
- Avg volume
- 1.74M
- Open
- 119.60
- Previous close
- 117.00
- Day's range
- 118.00 – 126.34
- 52-week range
- 73.54 – 175.64
- Analysts
- Strong Buy
- Price target
- 173.30 (+38.5%)
- Earnings date
- Feb 25, 2027
5D +5.70 (+4.78%)
Key statistics
- Enterprise value
- 28.17B
- PEG ratio
- 1.19
- Price / sales
- 4.76
- Price / book
- 3.45
- Dividend yield
- 0.27%
- Payout ratio
- 11.28%
- Revenue growth
- 21.90%
- Free cash flow
- 696.12M
- Total cash
- 1.12B
- Total debt
- 4.53B
- Return on equity
- 6.98%
- Short % of float
- 2.30%
- 50-day average
- 121.01
- 200-day average
- 129.79
Analyst view
Consensus: strong buy
- Target (low)
- 150.00
- Target (mean)
- 173.30
- Target (high)
- 216.00
- Strong buy3
- Buy7
- Hold0
- Sell0
- Strong sell0
Next earnings
Feb 25, 2027
Expected Feb 25, 2027. Consensus EPS estimate 1.28.
Financials — quick view
Earnings
| Report date | Quarter ending | EPS estimate | EPS reported | Surprise | Surprise % |
|---|---|---|---|---|---|
| Feb 25, 2027 | Dec 30, 2026 | 1.20 | — | — | — |
| Nov 4, 2026 | Sep 30, 2026 | 1.20 | 1.46 | +0.26 | +21.67% |
| Aug 4, 2026 | Jun 30, 2026 | 1.07 | 1.19 | +0.12 | +11.21% |
| May 12, 2026 | Mar 31, 2026 | 0.922 | 1.08 | +0.16 | +17.14% |
| Feb 26, 2026 | Dec 31, 2025 | 0.628 | 0.82 | +0.19 | +30.57% |
| Nov 6, 2025 | Sep 30, 2025 | 0.655 | 0.74 | +0.08 | +12.98% |
Upgrades / downgrades
| Date | Firm | Action | From | To |
|---|---|---|---|---|
| Nov 6, 2026 | Barclays | main | Overweight | Overweight |
| Nov 5, 2026 | Fermium Research | main | Buy | Buy |
| Oct 15, 2026 | RBC Capital | main | Outperform | Outperform |
| Oct 14, 2026 | Truist Securities | init | — | Buy |
| Oct 13, 2026 | Barclays | init | — | Overweight |
| Oct 1, 2026 | Mizuho | main | Outperform | Outperform |
About Qnity Electronics, Inc.
Qnity Electronics, Inc. provides materials and solutions to the semiconductor and electronics industries in the United States, rest of Americas, Europe, the Middle East, Africa, Asia Pacific, China, South Korea, Taiwan, and internationally. The company operates in two segments, Semiconductor Technologies and Interconnect Solutions. Its Semiconductor Technologies segment offers chemical mechanical planarization (CMP) pads and slurries, photoresists, functional sub-layers, advanced overcoats, post-CMP cleaners, post-etch residue removers, and emerging cleans. The Interconnect Solutions segment provides copper pillar plating, copper redistribution layer, solder bump plating, under bump metallization, photoresists, packaging dielectrics, gap fillers, phase change, specialty thermal interface materials, thermally conductive insulators, copper plating solutions, dry film photoresists, and laminates and polyimide films. The company was formerly known as Novus SpinCo 1, Inc. and changed its name to Qnity Electronics, Inc. in April 2025. The company was incorporated in 2024 and is headquartered in Wilmington, Delaware.
- Sector
- Technology
- Industry
- Semiconductor Equipment & Materials
- Country
- United States
- Website
- qnityelectronics.com
News
 Barclays Maintains Overweight on Qnity Electronics, Raises Price Target to $216
 Qnity Q3 Earnings Call Highlights AI Demand and Higher Outlook
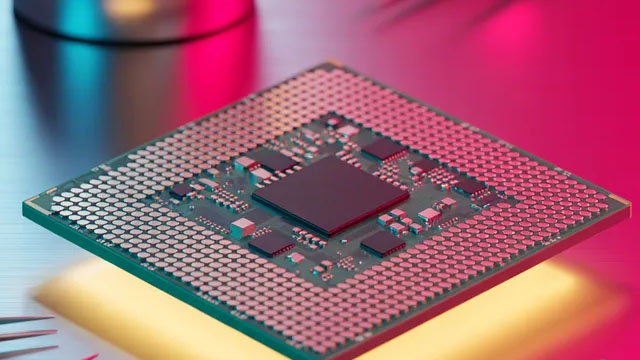 Qnity's Q3 Earnings Beat Estimates on AI Demand, Outlook Raised
 Fermium Research Maintains Buy on Qnity Electronics, Lowers Price Target to $160
 Qnity Electronics, Inc. (Q) Q3 2026 Earnings Call Transcript
 Qnity Electronics (Q) Q3 Earnings: Taking a Look at Key Metrics Versus Estimates
 Qnity Electronics Q3 2026 Earnings Call Transcript
 Qnity Electronics Q3 Adj. EPS $1.46 Beats $1.20 Estimate, Sales $1.556B Beat $1.487B Estimate
 Qnity Electronics Raises FY2026 Adj EPS Guidance from $4.40-$4.60 to $4.95-$5.05 vs $4.56 Est; Raises FY2026 Sales Guidance from $5.550B-$5.650B to $5.770B-$5.830B vs $5.636B Est
 Qnity Reports Third Quarter 2026 Results, Raises Full-Year Financial Guidance
Your note
Sign in to keep a note on Q — it syncs with the Stock Master app.
Insider holders
| Insider | Relation | Latest transaction | Date | Shares held |
|---|---|---|---|---|
| CURTIN TERRENCE R | Director | Stock Award(Grant) | Aug 30, 2026 | 26,586 |
| FORTEBUONO KATHLEEN M. | Officer | Stock Award(Grant) | Feb 26, 2026 | 8,973 |
| GOSS MICHAEL G. | Chief Financial Officer | Stock Award(Grant) | Feb 26, 2026 | 19,882 |
| GREEN BYRON | Director | Stock Award(Grant) | Aug 30, 2026 | 8,134 |
| HENNESSEY PETER W | General Counsel | Stock Award(Grant) | Feb 26, 2026 | 9,688 |
| KANG SANG HO | Officer | Conversion of Exercise of derivative security | Nov 20, 2025 | 15,646 |
Institution ownership
| Holder | % held | Shares | Value | Reported |
|---|---|---|---|---|
| Blackrock Inc. | 7.68% | 16,055,318 | 2.01B | Jun 29, 2026 |
| Vanguard Capital Management LLC | 6.54% | 13,674,813 | 1.71B | Jun 29, 2026 |
| Vanguard Portfolio Management LLC | 4.89% | 10,213,503 | 1.28B | Jun 29, 2026 |
| State Street Corporation | 4.48% | 9,364,085 | 1.17B | Jun 29, 2026 |
| Geode Capital Management, LLC | 2.71% | 5,672,741 | 709.38M | Sep 29, 2026 |
| Durable Capital Partners Lp | 2.18% | 4,553,414 | 569.40M | Jun 29, 2026 |
Fund ownership
| Holder | % held | Shares | Value | Reported |
|---|---|---|---|---|
| VANGUARD INDEX FUNDS-Vanguard Total Stock Market Index Fund | 3.18% | 6,646,668 | 831.17M | Jun 29, 2026 |
| VANGUARD INDEX FUNDS-Vanguard 500 Index Fund | 2.60% | 5,424,695 | 678.36M | Jun 29, 2026 |
| iShares Trust-iShares Core S&P 500 ETF | 1.33% | 2,787,427 | 348.57M | Sep 29, 2026 |
| Fidelity Concord Street Trust-Fidelity 500 Index Fund | 1.30% | 2,718,876 | 340.00M | Sep 29, 2026 |
| SPDR S&P 500 ETF TRUST-State Street SPDR S&P 500 ETF Trust | 1.24% | 2,595,544 | 324.57M | Sep 29, 2026 |
| ALLSPRING FUNDS TRUST-Allspring Special Mid Cap Value Fund | 1.17% | 2,456,028 | 307.13M | Aug 30, 2026 |